

With this article, we attempt to cover all the aspects of data science for beginners i.e. everything that a newcomer in data science should know. Whether you are a fresher or from another job background, you can start learning data science. You can be a self-taught data scientist or learn through the various courses available online and offline. If you have some programming knowledge and a background in mathematics, you can surely learn data science on your own. Nonetheless, those who aren't can also do so but with some extra effort. We will discuss what data science is, job prospects, roles, the data science process and many other interesting things about data science.
Why Data Science?
Before we get into data science for beginners, I want to make sure you are clear with why everyone is going gaga about data science. Firstly, the world currently generates more data than ever, and this data is used continuously by businesses to improve their customer service and innovate new products based on customer feedback. So, there is always a demand for data scientists in every domain, be it e-commerce, medicine, defense, and whatnot. Secondly, data science itself has many sub-fields and specialization in one or more can fetch you any role – data analyst, data engineer, statistician, data scientist, administrator, architect, business analyst, etc. With so many opportunities in hand, it only makes sense to learn data science, so that you can perform any of these roles. Last and the most important one – the data scientist role can fetch you a fat salary package! As the role is very challenging and elaborate, there is a potential to earn a lot! Next in this data science for beginners article, we discuss data science.
What is Data Science?
Wikipedia calls 'Data Science' an interdisciplinary field that uses scientific methods, algorithms and processes to extract useful insights from huge volumes of data. By interdisciplinary, we mean that data science needs knowledge of more than one branch or subject. For example, on one hand, you need to be an expert with math, and on the other, you should be adept with programming. A typical day in the life of a data scientist involves dealing with a thorough study of business, defining business problems, gathering relevant data, cleaning and transforming it, analyzing and visualizing it and then coming to some predictions or conclusions. To perform data science, we need a combination of knowledge and tools. Tools help reduce the time taken to perform common tasks so that data scientists can focus on the business problem rather than worrying much about implementation.
How is Data Generated?
Data can be generated in many ways. The most common way that we see every day is social media. Social media sites are open to all and have a huge user base. Consider Facebook or Instagram. There are millions of users, and so many of them keep posting, liking, commenting, uploading and browsing something. These activities tell companies about a user's likes and dislikes. Based on this, companies can send targeted emails and other marketing content to those customers, who might be interested to know more. Here are a few ways in which data is generated:
-
IoT (Internet of Things)
Whether we know or not, we generate a lot of data on the internet. The Internet is not only on our computers, but also on TV, watches, kitchen appliances, speakers, cars, and many other devices. These devices track our movements and collect data. These are called 'smart,' and sure enough, they are smart in collecting every small bit of information about us. When these individual devices are connected, for example, during your morning run, you listen to your favorite music and keep track of your distance and time through a smartwatch. Both these devices understand your preferences, daily activities and generate data. The data collected by IoT is measured in zettabytes, which is an equivalent of one trillion gigabytes.
-
Social Media
As we discussed before, most of us use at least one social media platform – YouTube, Facebook, Twitter, Instagram, etc. These collect data about the user's preferences and understand what they are interested in. For example, if you keep watching tennis videos more often, YouTube suggests more of those so that you stay on YouTube for a longer time.
-
Online Transactions and Browsing
We do a lot of transactions online, and more so, after COVID-19, many of us who were going out to purchase groceries, milk and clothes outside have also started exploring online options. Bank transactions, educational content, online shopping, watching movies, playing games, almost everything is online. Thus, we, in the process, give away much of our information to companies who are looking for data to improve the experience of their services and products. The data that is generated by these sources is usually unstructured, i.e. having many mistakes, raw or messy! This makes it all the more challenging for a data scientist to filter and use only the relevant data.
Scientific methodology to perform data science

Data science can be performed by combining the following methods:
- Technology/Programming : A data scientist uses many tools and programming languages to solve various problems and apply algorithms. For example, to clean and prepare data for processing, we need tools like Hadoop, Spark so that the data is in a good shape to analyze. Similarly, to visualize data in the form of charts, we need tools (like MS Excel and Tableau) that can convert statistical data into a chart or graph. Same way, for predictive analysis, or to solve a business problem through machine learning algorithms, data scientists need to know programming languages (like Python, R, Java, and SQL) to write algorithms or use existing ones.
- Statistics and Mathematics : To filter and clean data, find correlations, variance, mean, median and perform analytics, we need to know various statistical concepts and foundational mathematics like matrix, linear algebra, and calculus. To know more about these skills, read our article on math skills for data science .
- Business and Domain Knowledge : To solve a business problem, it is critical to understand the domain in which you are working and the problems that can arise. Data scientists are also involved in defining problems based on user data and making relevant business decisions. All these steps require thorough business understanding.
The above are the core skills required to be a successful data scientist. Other skills like creative thinking, problem-solving skills, and good communication are also important.
Data Science Job Roles
As we discussed before, there are many roles in data science. Some of them are:
- Data Scientist : This person is responsible for the entire data science process. It starts from defining business problems and talking to stakeholders to preparing visualizations for the data and making decisions.
- Data Analyst : Analyzes the data by using various tools, languages and techniques. Performs exploratory analysis and finds trends and patterns and interprets them to influence business decisions.
- Data Engineer : A data engineer is responsible for data acquisition, improving the quality of data by applying various tools and techniques. She is also the one to prepare the data for predictive and prescriptive modeling, and develop data set processes.
- Data Architect : Builds secure data systems and creates a blueprint for development. Also responsible for testing and maintenance of the database, optimize database systems, improve system performance through tests, and troubleshooting.
- Statistician : An expert in applying statistics and mathematical concepts to business problems.
- Machine Learning Engineer : Responsible for applying the right algorithms and feed the machine with the required dataset.
- Business Analyst : Uses data analytics to access and determine requirements and gives data-driven recommendations.
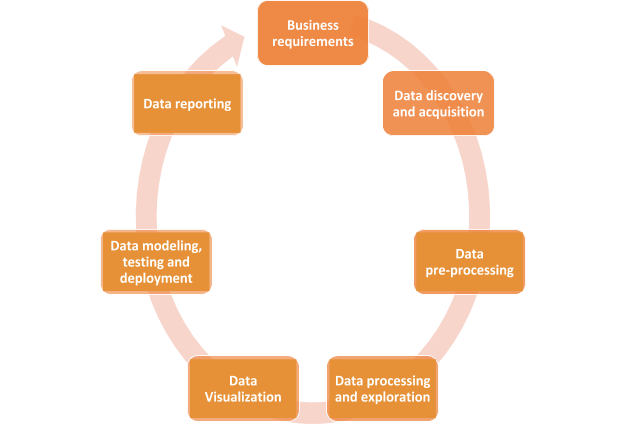
Data Science Lifecycle
Data science lifecycle consists of various steps, as mentioned in the below picture:
-
Business Requirements
This is the first step of data science where the business requirements are defined, and all the stakeholders sit together to define and finalize the business problem that needs to be solved.
-
Data Discovery and Acquisition
Based on the business problem, data scientists and engineers acquire data from various sources, like online surveys, interviews, databases, and the cloud.
-
Data Pre-processing
The data obtained using various sources are mostly raw and unstructured data. Thus, it cannot be directly used for analysis. The data has to be first converted into a more usable form, which is done through data mining. It is a process where raw data is turned into useful information. Data mining is also called Knowledge Discovery in Data as a larger dataset is analyzed using software tools to more organized data.
-
Data Processing and Exploration
This is the initial step of data analysis to determine the data quality, i.e. whether the data is fit for use and has all the necessary features. Data analysts also use visual and statistical tools and techniques to understand the features, size, accuracy, and quantity of data in a better manner. They can spot outliers, general trends and patterns.
-
Data Visualization
Data visualization helps data scientists and data engineers to ask the right questions that can solve the business problem(s). For example, whether a feature is necessary for building the model, or can we eliminate it? Visualization tools also summarize important data points and can represent data in many different ways with the help of charts and graphs. These tools can also help in identifying missing values, null values, data imbalance and outliers. Tableau and Excel are great visualization tools that can aid in performing exploratory analysis and represent data visually.
-
Data Modelling (machine learning)
After the initial data analysis, now it is time to apply algorithms and see the machine working! In this step, the cleaned and transformed dataset is supplied to the machine. The machine is then trained (by an external supervisor or by itself). The machine builds a model, trains it and tests it using training and testing datasets respectively. It is the duty of the machine learning engineer or the data scientist to decide the best algorithm to be applied for a particular problem. Sometimes, more than one algorithm may be applied. Machine learning is useful for predictive analysis and helps conclude the data science process.
-
Data Reporting
Reporting is essential to communicate the findings of all the above steps to business analysts and various stakeholders. As everyone is not technically proficient, a report should be simple and effective. It must contain all the information in an easy-to-understand manner so that a conclusive decision can be made to make decisions for the business problem for which the analysis was done in the first place.
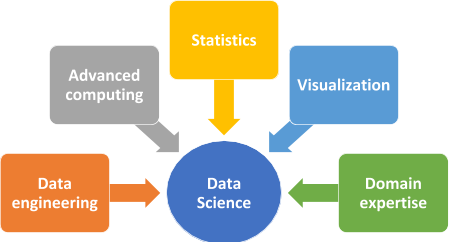
Data Science Components
Data science has several components. Some of these we have already touched upon in the previous sections of this article on data science for beginners:
-
Data Engineering
As we have seen, data engineering deals with data collection and storage, data wrangling and ETL (Extract, Transform and Load). Data wrangling is the process of cleaning the data to adjust missing values, correcting data types, parsing, ordering date-time, strings, etc. in a proper format and text transformation.
-
Advanced Computing
Advanced computing is a high-performance computing environment for tackling huge volumes of data. These computers need to have high computational and processing power to deal with complex calculations as well. To perform machine learning and deep learning, we need systems that are fast, efficient and can process huge amounts of data.
-
Statistics
Through statistics, huge volumes of data can be summarized, and insights can be easily obtained. Statistics is helpful in many stages of data science, like cleaning, visualization and analysis.
-
Visualization
Rather than analyzing huge volumes of numerical data, visualization helps us to view the main features of data in a visual, easy-to-understand form. This helps in speeding up the data analysis process.
-
Domain Expertise
Understanding the domain is key to identifying the business problem and arriving at good business decisions. Data science is applied in almost all the domains, like finance, e-commerce, healthcare, logistics, and supply chain. Knowing the domain helps you understand what you know, what you do not know and what you want to know.
Netflix - A Simple Case Study
Nowadays, because of COVID-19, many of us are stuck at home and prefer watching some good movies/series, especially over the weekend. Netflix has been our savior for the same. It goes to the extent of suggesting movies to users based on their previous views and preferences. Is Netflix human? No. So, let's see how Netflix provides movie/series recommendations! For this, we will go through each step in the data science lifecycle that we discussed before:
Business Requirement
Recommend movies to a user based on their preferences.
Data Collection
Data from each user is collected. This includes the movies they like, the genres they prefer, ratings for various movies and so on. This is done when you create a profile and log in to Netflix every time. Imagine the amount of data that will be collected per user. Suppose there are 1,000 movies on Netflix and 1,000 users. That itself is 1000*1000 possible mapping of movie and user data!
Data Preparation
The data collected is raw. There is a need to organize it properly. For example, not everyone gives ratings for all the movies creating NULL in some places, or there may be a one-off case who rated a movie as '1' while most others gave a rating of more than 3. Same way, many similar users with similar interests can be there, thus creating redundancy. Some values may be missing and/or duplicate, making the patterns misleading. To correct all this requires a lot of work, namely cleaning, sorting, extracting relevant features, organizing the data and much more.
Exploratory Data Analysis
The data is now clean, organized and ready for analysis. First, we try to find high-level similarities and patterns. For example, which are the most popular movies? What genres does a particular user like? Are there any other users who like the same kind of movies? If so, what else are they watching? Which other users have watched most movies in a particular genre? And so on. This stage is all about asking the right questions so that we can confirm if the data quality is good to go for further processing.
Data Visualization
So, how do we know the most important features in the data that will help us determine the answer to our business problem? It isn't easy to analyze a huge amount of data in numerical form. In the previous stage, we can use statistical methods like mean, median, variance, etc. to find summaries, groupings, etc. But, what inference should we take from that? Data visualization helps us make inferences and represent data in graphical form for easy view and analysis. We can depict sum, average and many other functions graphically and plot charts like histogram, bar, box, etc. to get different perspectives of the data. We will also be able to determine the most important features. For example, in our case, it will be a movie name (or id), rating and number of views. Based on these, we can recommend any movie to users. If we also include location, we can know the popularity of movies in a particular location. For instance, people in Maharashtra, India might prefer watching regional movies over Hollywood or Bollywood movies. Through visualization, we can easily mix and match all the features and variables that describe data to find out the most important features.
Machine Learning
Now that we have seen that there is a pattern, we can feed the dataset to a machine learning algorithm that will come up with a generalized model for the same. It is like a talk between 2 humans: Human A: Hey, did you watch the action movie ABC? Human B: Yes, I love action movies. Most of the time, I watch action and horror movies! Human A: Oh, in that case, you should definitely watch PQR and XYZ. These are action movies with a great story. For me, they are 5/5. Only that, in place of human A, there will be a machine. Creating a model is important so that the machine can give recommendations for any user on the basis of various criteria. This is a purely technical stage, which involves programming knowledge. Through programs, you can create, train and evaluate the accuracy of a model.
Data Reporting
Once a model is finalized, it has to be deployed, and the findings should be submitted to the business analysts and stakeholders. In our case, it will be the trained model, how we arrived at the results, visualization data, etc.
Data Science Job Trends
Data science has only been growing over the years, a trend that will grow further. Some top companies that hire data scientists are IBM, Microsoft, Google, Facebook and Amazon. Also, the maximum number of data science jobs are in the USA, followed by India, France and the UK. As we have seen above, these openings can be for a data scientist or a more specialized designation like a data engineer or machine learning engineer. The USA pays about $120,000 yearly compensation to a data scientist. Australia is the next one at $107,601. Out of these roles, a business analyst has more prospects.
Conclusion
In this article about data science for beginners, we have seen all the basics of data science to get you started on this journey. You can start learning right now through online blogs, tutorials and other beautifully curated content on the web. You should definitely buy a few data science books that will help you understand each concept of data science. People are also reading:


Leave a Comment on this Post