

Python for data science is what mathematics is to physics, an invaluable tool. In this article, we will discuss the concept of data science and why Python is important for data science and how to use it. So, let's march on.
What is Data Science?
Termed as an interdisciplinary field, data science is indeed a field that consists of collection, preparation, analysis, visualization, and reporting of data to get valuable insights from the same and make future predictions. For example, a company whose sales are going down can collect data from the time when the sales dropped and analyze the data to find the root cause - by detecting the patterns - and suggest a future course of action and also, make a forecast based on the past and current conditions.
Why Python for data science?
Performing a detailed analysis of data – by both humans and computers – is not easy . Computers can, however, do it with ease when the inputs are correctly given. But we can’t expect the input to be perfect always as it can come from various sources and is raw and unstructured. Here begins the journey of Python for data science! At every stage of data science, Python is used to perform various tasks. The popular programming language has a rich set of libraries and functions that are extremely useful for data science. Using Python, for example, you can load, clean, prepare and transform the data. Also, you can analyze the same using machine learning algorithms and generate reports and visualizations. Python is simple to learn, has a syntax that’s just like plain English, and most importantly, has an exhaustive set of libraries that cater to all data science needs. All you need to know is how to use different functions for different data science tasks. Python also has extensive documentation, plus the online community is vast and helpful. Further, the Python package itself comes with example datasets for you to toy with and learn at the same time.
How to Learn Python for Data Science?
Let us take a quick tour of Python. We will be focusing on the Python concepts that are most useful for data science throughout this article, but first, we need to get the basics right.
Installation and Basic Syntax
Let's start with installing Python; then, we will get onto simple programs where we will explore variables, data types, loops, conditions, operators, functions, and more. Python installation is effortless. Just download the distribution (available for Windows, Linux, and macOS) from the official Python website. Once you download and install Python as per the instructions, open the command prompt (terminal in Linux and macOS) and type python. You will get the version number. Next, you can explore and check out various commands. You can directly work on the command line, but for a more interactive experience, you can install a Python IDE like Jupyter or PyCharm . To install Jupyter, use the command “install jupyter”. To run jupyter, type “jupyter notebook,” and it will open a notebook in your browser. You can select a new document and start coding.
Our First Python Program
If you haven’t done your Python set up – go for it. There is no better time than now. Next, write a simple program that scans a few words from a list to find a particular word. Don’t worry about the explanations yet, we will go into that later.
mylist = ['apple', 'grapes', 'banana', 'orange', 'mango']
count = len(mylist)
print(count)
# iterate through each item in the list
for i in mylist:
# if it is banana
if(i == 'banana'):
print("i dont want to eat bananas")
#if it is mango, a special message
elif(i == 'mango'):
print("i love mango")
# common message for others
else:
print("good fruit : " + i)
#print the fruit list
print(mylist)
This is a simple Python program that takes a list of fruits, iterates over each item, and prints specific messages.
Python Syntax
Python is very particular about indentation. If you leave or omit unnecessary spaces, the code will not work. For example:
if num > 10:
print(“You win”)
is not treated the same as:
if num>10:
print(“You win”)
The latter will give an error because of the indentation.
Python Comments
Python supports one-line comments using ‘#.’ For example:
#This is a single-line comment.
If your comments occupy more than one line (multi-line comment), you can use “”” (triple quotes).
“””
This is a multi-line
comment. Of course, not as
neat as a single line comment.
“””
Variables in Python
Unlike other popular programming languages like C++ and Java, there is no need to declare variables in Python. You need to assign a value to the variable. For example:
x = 44
name = “TechGeeks” or name = ‘TechGeeks’
Notice that there is no need to specify the data type as well. However, variables should start with a letter or underscore, but never with a number. Also, variable names are case-sensitive and can contain alpha-numeric characters and underscores. You can assign values to multiple variables in a single line, as shown below:
x, y, z = 10, 20, 30
To make a variable global, we can add the keyword global to the variable.
Data Types
Python supports a lot of built-in data types :
| Numeric | int, float, complex |
| Text | String (str) |
| Boolean | bool |
| Sequence | list, range, tuple |
| Set | set, frozenset |
| Map | dictionary (dict) |
| Binary | bytes, bytearray, memoryview |
Since we do not explicitly declare variables in Python, to get the data type of a variable, we can use the type() method. For example, type(y) where y is any variable. It is also possible to specify the data type using the constructor methods. For example:
C = int(10)
Mylist = list([1, 2, 3, 4, 5])
Some examples of each data type are:
| Numbers | a = 10 f = 12.3455 b = 2e4 cplx = 1 + 2j |
| Strings | name = ‘tgb’ name = “tgb” Note : There are many string operations like slicing, negative index, length, lower(), upper(), split(), and replace(). Strings can be concatenated using the + operator. |
| Booleans | Statements like 1 > 2, 5> 4, etc will return a Boolean value, i.e. either false or true. Note : Booleans are also used for evaluating if conditions. |
| Operators | There are many operators like + , -, *, /, **, =, +=, -=, >>=, ==, >, >=, and, or, not, is, is not, in, and not in. x + y a not in mylist y > 5 a !=b |
| Lists | mylist = [“machine learning”, “data science”, “artificial intelligence”] intlist = [1, 3, 5 ,7, 9] |
| Tuples | mytuple = (“machine learning”, “data science”, “artificial intelligence”) Note : Tuple is unchangeable and ordered. |
| Sets | myset = {“machine learning”, “data science”, “artificial intelligence”} Note : These are unordered and unindexed collections. |
| Dictionary |
mydict = {
"0098": "maths",
"0101": "english",
"076": "science"
}
|
Conditional Statement (if-else)
a, b = 10, 12
if(a>b):
print(“a wins”)
elif(a==b):
print(“a & b win”)
else:
print(“b wins”)
While Loop
i = 1
while(i<=5)
print(i)
i++
For loop
For and if are the most used statements in Python for data science. ‘for’ is used for iteration while if is for conditional statements.
mylist = [‘maths’, ‘english’, ‘science’]
for i in mylist:
print(i)
This will print the contents of the list one by one.
Functions
Just like other programming languages, we can define functions that can have input and output parameters and are executed when called.
def myadd(a, b, c):
return a+b+c
To call the function, just type it with the parameters. For example, myadd(1, 2, 3).
Python Libraries for Data Science
There are many useful libraries in Python for data science. Some of the best ones are:
1. NumPy
Numpy means Numerical (Num) Python (Py). This library has rich features like basic linear algebra, n-dimensional array, random number capabilities, matrix computations, Fourier transforms, and integration tools for C, C++, and Fortran. The most powerful feature of numpy used across all the data science projects is the n-dimensional array. As Python itself supports only lists (and not arrays), numpy can be used to convert the list to an array. This helps in the data evaluation stage of data science. Use the following command to import NumPy:
import numpy as np
Before using numpy, you should install it by using the following command:
pip install numpy
Here is a snippet of how n-d-arrays can be created using numpy:
import numpy as np
#simple array
mylist = [1,2,3,4]
arr = np.array(mylist)
arr[3] = 7
print(arr)
#create an array of zeroes
arrzero = np.zeros([3, 3], dtype = int)
print(arrzero)
#create an array of ones
arrone = np.ones([3,2], dtype = int)
print(arrone)
Try these commands on your editor and let us know what you get. Numpy is the basic package that is required by other scientific packages like scikit-learn, OpenCV, and scipy.
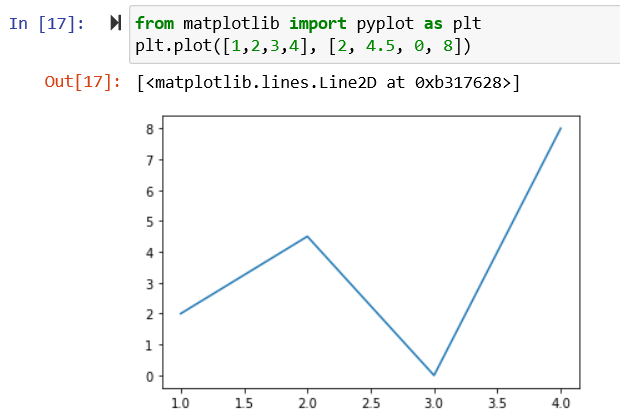
2. Matplotlib
It is one of the most common libraries used for the data presentation stage of data science. A comprehensive library that can create static, dynamic, interactive and animated visualizations, matplotlib is widely used for creating different types of graphs that represent data using pyplot. To install matplotlib, use the following command:
pip install matplotlib
You can then use any functions inside the library to create various graphs. For example:
from matplotlib import pyplot as plt
plt.plot([1,2,3,4], [2, 4.5, 0, 8])
3. Pandas
Pandas, meaning Panel (Pan) Data (da), is a rich library that helps in the ETL (Extract-Transform-Load) phase of the data science process. It is also used in many machine learning and deep learning use cases. The usage of Python for data science drastically increased after the introduction of Pandas library. It contains single and multi-dimensional data structures that are used for data manipulation. For example, you can create a dataframe or series from a list, dictionary or any other collection. To install pandas library, use the following command:
pip install pandas
Try this simple code that converts data into a tabular format:
import pandas as pd
pd.DataFrame({"EmployeeId": [12, 13, 14, 15],
"Skill": ['Data science', 'machine learning', 'java', 'python']})
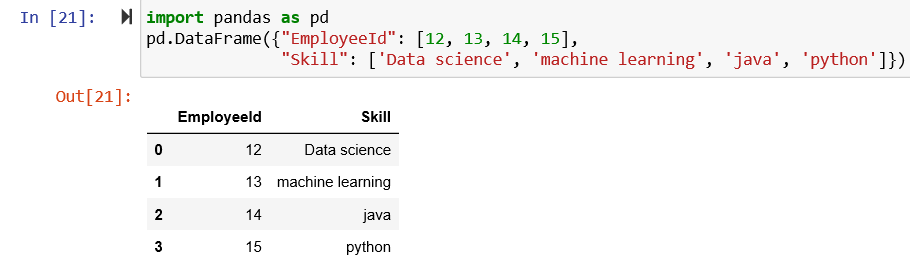 Note that in Python, a sequence is created by default and starts with zero. As you see, a neat structure is created. With this kind of presentation, you can easily perform data manipulation operations like merging datasets, column insertion, deletion and renaming, handling missing values and duplicate data, data sorting, row insertion, renaming and deletion, data exploration, and visualization.
4. Scikit-learn
This free Python library is the magic potion for machine learning algorithms. It contains brilliant tools for data mining and analysis. Algorithms like classification, logistic regression, and times series can be implemented by using the sci-kit learn library. Check out the most common examples on the official scikit-learn website .
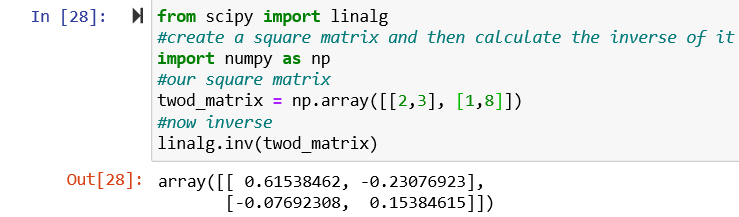
5. Scipy
Scipy is an important library that is used for scientific computing, mathematics, engineering, etc. There are many useful sub-packages like linalg(linear algebra), interpolate, integrate, stats(statistics), signal, and ndimage(image manipulation). Just like Scikit-learn, it is used for the data modelling stage in data science. You can think of Scipy as an advanced version of Numpy, as you can find most data science features in Scipy. To install the Scipy package, use the following command:
pip install scipy
Try this simple example of using scipy for linear algebra functions:
from scipy import linalg
#create a square matrix and then calculate the inverse of it
import numpy as np
#our square matrix
twod_matrix = np.array([[2,3], [1,8]])
#now inverse
linalg.inv(twod_matrix)
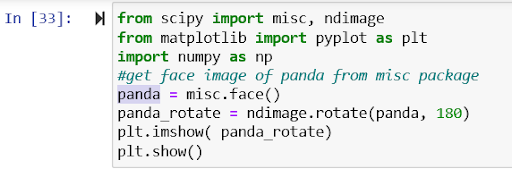
 Also, try this interesting example of image rotation using scipy:
from scipy import misc, ndimage
from matplotlib import pyplot as plt
import numpy as np
#get face image of panda from misc package
panda = misc.face()
panda_rotate = ndimage.rotate(panda, 180)
plt.imshow( panda_rotate)
plt.show()
Scipy can also be used for Fourier transform, eigenvalue, eigenvector, integration, etc.
6. TensorFlow
It is used in the data evaluation phase of data science. It is an end-to-end open-source library to manage all the aspects of machine learning. The primary variant of tensorflow is tf.keras which consists of machine learning algorithms to make predictions. To learn TensorFlow, you should know the basics of numpy and pandas. Check out this simple linear regression mode l built using TensorFlow. The code is written in colab (which is similar to jupyter).
7. Statsmodels
Used for data modelling, testing and analysis, statsmodels is a library that has an extensive list of descriptive statistics, plotting functions, statistical tests, and result statistics for different data types. You can think of this library as a complement to the scipy library. Check the features (models included) of Statsmodels here .
8. Seaborn
Seaborn is an amazing data exploration library based on matplotlib. You can create some beautiful visuals using this library. Install seaborn using the command:
pip install seaborn
To import this library, use the following command
import seaborn as sb
Try this simple time series line plot using sample data that comes with the library. There are many more features in Python, but the above are good to start using Python for data science. We will now look at specific features that are widely used for data science. As an example, let us try to fetch the data from a file, display it nicely, get some insights, and look at them visually.
Features of Python for Data Science
If you are overwhelmed with the information presented in various blogs and are confused about how to start using Python for data science, you have come to the right place. In this section, we will go step-by-step to tackle a simple problem. We won’t use a real dataset, instead create a dataset with few rows. The intention here is to understand how we can use Python for data science. Although we will not get a very accurate result (due to lack of data), by the end of this, you will be able to understand how Python libraries work and how each of them can be used at various stages of data science.
Problem Statement
Finding the best candidates in a firm based on their skills and performance to form a team for the upcoming gaming challenge.
Loading Data with Python
We have created a dataset with few values. First, we need to load the data. This can be easily done using the read_csv() method of the pandas library. If your data is in an excel file, you can use the read_excel() method. But, before we do that, we need to import the libraries. We will need pandas (which uses numpy), matplotlib, and seaborn.
import pandas as pd #for data loading, cleaning
import seaborn as sns #data visualization
import matplotlib as mpl #plotting
import matplotlib.pyplot as plt #plotting

#get data from the source
data = pd.read_csv(r'C:\Users\Ramya\student_details.csv')
For the data file, click here. ( Note : This is not real data, it is just a simulation to get a grasp of important concepts. You can play around with this data as much as you want to.)
Cleaning and Sorting the Data
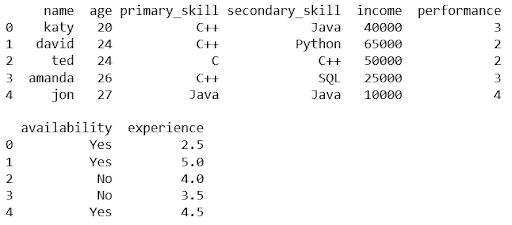
Before we can take out important insights from the data, we need to make sure that we are able to see the data properly. It will help us to know what details we need. Let us use pandas dataframe to present the data in a tabular form as shown below:
#create a dataframe (tabular structure)
gameteam = pd.DataFrame(data, columns = ['name', 'age', 'primary_skill', 'secondary_skill', 'income', 'performance', 'availability', 'experience'])
#list the first 10 rows
gameteam.head()
#let us now clean the data, by removing empty, null, and duplicate values
gameteam.isnull().sum()
gameteam = gameteam.dropna()
In our data, there are no null or duplicate values as of now, but we will be using this feature again later.
Data Visualization with Python
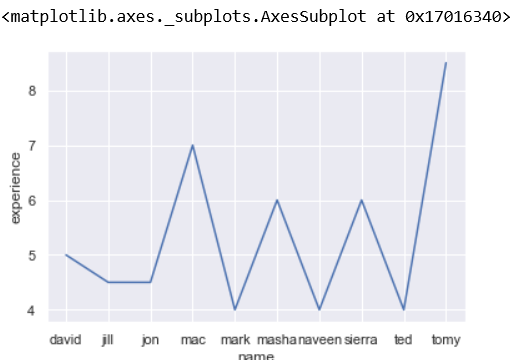
So, as the first thing, let us view the experience of only those who have experience of more than 3.5 years. You will be amazed at how simple this is:
#for visualization we need to use seaborn and matplotlib
sns.lineplot(x='name', y=(gameteam.experience[gameteam.experience>3.5]), data=gameteam)
With the above code, you will get a line plot like this:
Next, let us create a boxplot to find the five-number summary of the dataset. We will do this for the income and experience values from our data.
sns.boxplot(x = 'experience', y = 'income', data=gameteam)
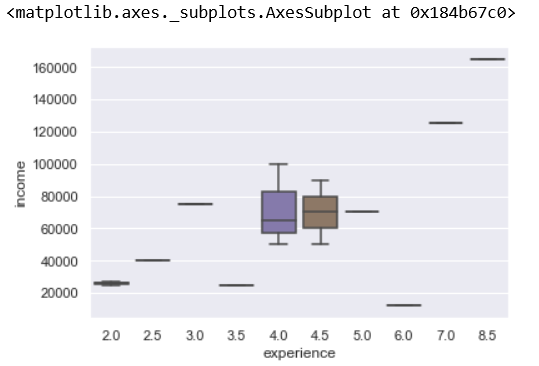
Let us quickly analyze this boxplot. For example, if you see the x-axis value 4.5 (experience), there are two values in the data set.

Box plot depicts the following values: The maximum value is represented by the upper whisker = 90000 The minimum value is represented by the bottom whisker = 50000 Median represents the middle value i.e. (90000+50000)/2 = 70000 The first quartile (median of the lower half of the dataset) = 60000 Third quartile (median of the upper half of the dataset) = 80000 Read more about box plots .
Histogram
How about dividing the population into intervals based on experience? For example, separate those who have an experience less than some number of years from those who have more. We can do this using a histogram . By choosing the bin or bucket value, we can decide how to split the data. The value to split is determined based on the max and min values in the distribution.
#let us see the distribution of experience using histogram
#you can change the bin value - as you increase, you will see how the values spread
#gameteam['experience'].hist(bins=2)
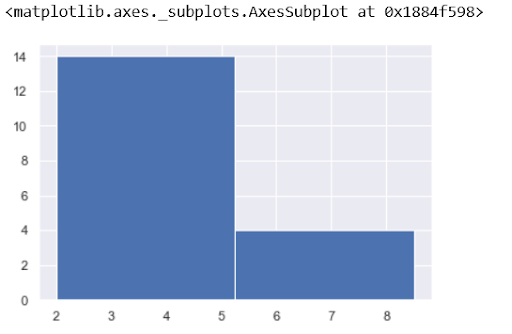
Change the bin value to 3 to see how the data is spread into least, average and most experienced candidates. Next, let's find out who is available to work for our gaming challenge and has the right skills. For this, we need to filter the data based on some conditions. Suppose the primary skill required for gaming is C++. We can get names of those who have C++ as the primary skill and are available for the challenge.
finalteam = gameteam[['name', 'experience']]
finalteam.name = gameteam.name[(gameteam.primary_skill == "C++") & (gameteam.availability == "Yes")]
#remove null entries
finalteam = finalteam.dropna()
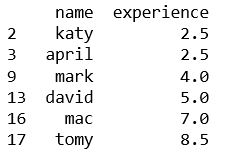 Here, we get a list of qualified candidates. We can plot a line plot to understand how varied their knowledge would be based on the experience they have. Let us sort based on the experience from lowest to highest value. This can be done using seaborn’s
pointplot()
method.
Here, we get a list of qualified candidates. We can plot a line plot to understand how varied their knowledge would be based on the experience they have. Let us sort based on the experience from lowest to highest value. This can be done using seaborn’s
pointplot()
method.
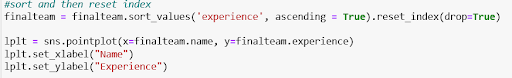
#sort and then reset index
finalteam = finalteam.sort_values('experience', ascending = True).reset_index(drop=True)
lplt = sns.pointplot(x=finalteam.name, y=finalteam.experience)
lplt.set_xlabel("Name")
lplt.set_ylabel("Experience")
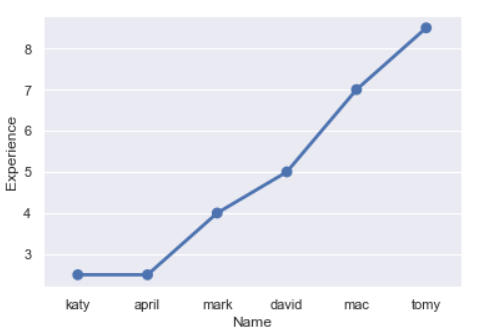
So, that’s about it. We did some quick analysis and visualization of data using Python.
Building a Predictive Model
However, learning Python for data science is incomplete without building a predictive model. We need to know which of these candidates are most likely to be selected for the game challenge, which is based on their performance. Since we have only a few rows, we found out the best performers just by looking at the graph. However, we can get this same information using machine learning algorithms too, which is much easier when we have a huge dataset. Let us define the criteria again:
- Candidates must have C++ as their primary skill.
- They should be highly performant.
- Candidates should have experience of at least 3 years (optional).
- They should be available for the challenge.
The simplest model we can use for this is the decision tree model, where through a set of questions, we will be able to get the answer to our criterion. Check out our article on the decision tree for machine learning that implements a decision tree in Python. Which other models do you think will work here? Let us know in the comments.
Decision Tree Classifier
Let us make a decision tree classifier as an example. Note that as this is an introductory (basic) article, so, we will not go into correcting overfitting and other issues with accuracy. In this article, we focus on learning how a model works. Before passing data to our model, we need to convert string values like primary_skill, availability to numeric values, as sklearn won’t accept any other values.
from sklearn.tree import DecisionTreeClassifier, export_graphviz
from sklearn import metrics
from sklearn.preprocessing import LabelEncoder
#all the values should be numeric, so we need to assign codes to fields like primary_skill
#and availability
def encodeMyFeatures(df):
columnsToEncode = list(df.select_dtypes(include=['category','object']))
le = LabelEncoder()
for feature in columnsToEncode:
try:
df[feature] = le.fit_transform(df[feature])
except:
print('Error encoding '+feature)
return df
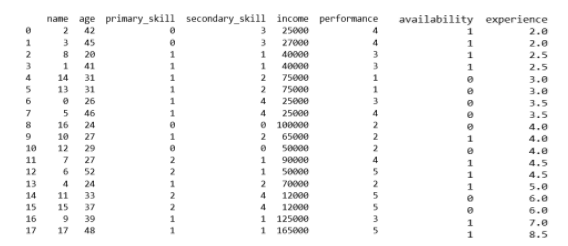
gameteam = encodeMyFeatures(gameteam)
print(gameteam)
Now, let's use the model to predict the values of performance:
model = DecisionTreeClassifier()
predictor_var = ['experience','primary_skill','availability']
#Fit the model:
model.fit(gameteam[predictor_var],gameteam['performance'])
#Make predictions on training set:
predictions = model.predict(gameteam[predictor_var])
print(np.sort(predictions))
#Print accuracy
accuracy = metrics.accuracy_score(predictions,gameteam['performance'])
print ("Accuracy : %s" % "{0:.3%}".format(accuracy))
Note that if the data set is small, we would get good accuracy. This is a very simple model built with a lot of things left out, such as outliers, over-fitting, and underfitting. However, with this, you should be able to use Python for data science, end-to-end.
Conclusion
Data science is vast, and so is Python. However, with just some basics of both, you can focus on learning Python for data science to start working on technical aspects of data science. Python will help you grow as a programmer as well as a data scientist. In this article, we have used packages that cover end-to-end stages of the data science process, from preparation to visualization. Check out our complete Python tutorial , where you can start from scratch and get in-depth knowledge of Python for data science and otherwise. People are also reading:


Leave a Comment on this Post