
Want to know how to become a data scientist? Check out this comprehensive data science roadmap for 2023!
I searched a lot on how to become a data scientist on the web and frankly speaking, I did not get any comprehensive answer. There are lots of blogs and articles, but they miss the ‘hands-on experience’ part of it, which I feel is more important than all other skills.
Till you have done a project or two, you will never know the ‘real’ problems faced by data scientists. Even after having all the foundational, business, and presentation skills, you might face unknown challenges every single day.
That said, there should be a starting point, and therefore, I thought of putting all the resources that have helped me so far in one place, so that a beginner can know what to focus on. Of course, the hands-on experience and projects will come in handy later on, but to start with, everyone should concentrate on honing their basic skills.
So, let's start the data science roadmap.
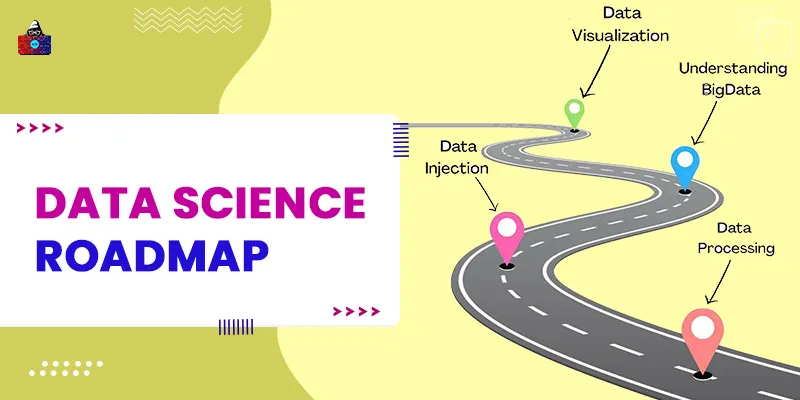
Data Science Roadmap
A roadmap is like a checklist that you keep referring to upon reaching each milestone (checkpoint). Let us explore each step (milestone) of the data science roadmap, starting with the maths:
Step 1: Mathematics
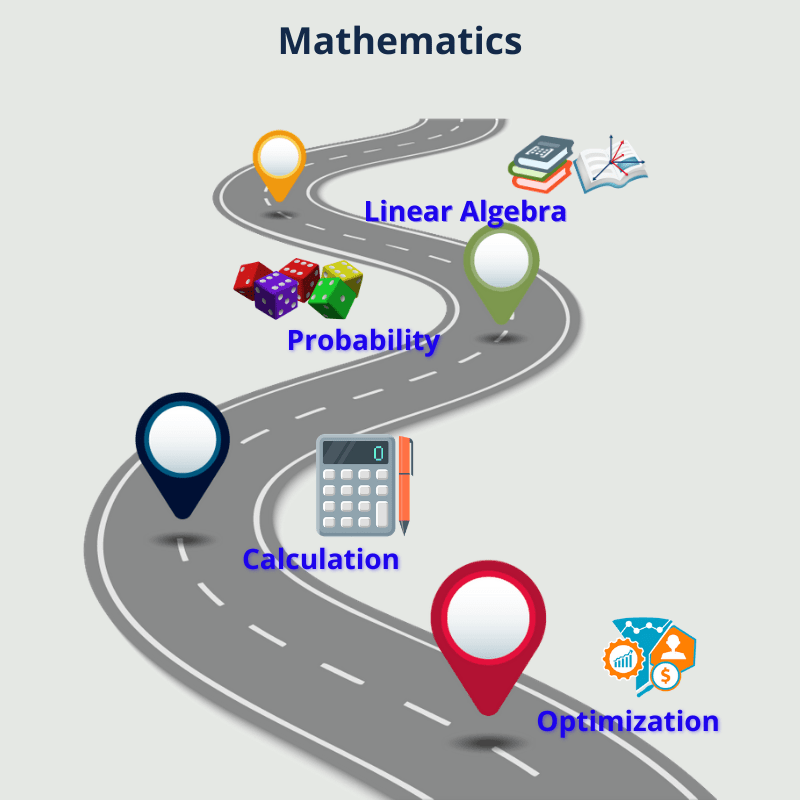
Knowledge of mathematics is a core skill for a data scientist. If you are an engineering graduate, you should already be familiar with most of the advanced concepts like matrices and vectors.
Well, if you are not, you will vaguely remember the below topics. You might think that high school math was scary, but frankly, you will appreciate what you have previously learned because you can see things happening for real.
1. Linear Algebra
Linear algebra includes linear equations (e.g. y = 2x+1), vectors, matrix and operations, types of matrices, sets, log and exponential functions, eigenvalues and eigenvectors, functions, and so on.
If you have heard of a few machine learning algorithms, you will be able to appreciate the above linear algebra concepts. Vectors and matrices form the basis of solving any data science problem. A large amount of (unstructured) data is most easily represented using vectors and matrices.
As an example, if each employee of your organization has 3 core skills (say, SK1, SK2, SK3), then those can be represented using a skill vector having 3 dimensions. This vector acts like a list.
Now, think about the actual data. Let’s say there are 10 employees (E1, E2…E10), so we will have a skill vector for each employee, i.e. a list of lists, which is nothing but a matrix.
EmpSK = [[E1SK1, E1SK2, E1SK3], [E2SK1, E2SK2, E2SK3]………[ E10SK1, E10SK2, E10SK3]]
This is nothing but a matrix with 10 rows and 3 columns.
2. Probability
Probability means ‘chance.’ A chance that something will (not) happen. A very common example is the chance of getting a head when you toss a coin. Since there are 2 possible outcomes i.e. heads or tails, the probability of each is equal, which is 50%.
Probability types like joint probability, conditional probability, and marginal probability are commonly used in decision trees and Bayes theorem for machine learning. Probability distributions, like Bernoulli distribution, uniform probability distribution, normal probability distribution, and exponential distribution are used extensively for likelihood estimations, exploratory data analysis, pattern analysis, detecting outliers, et cetera.
3. Calculus
Calculus helps to generalize the solution. For example, for analysis, if we select a certain training set and get the results, we need to make sure that the same result applies to the rest of the data set.
Similarly, multivariate calculus becomes essential when the data has multiple variables. For example, height, weight, and age are important parameters to screen a patient for an ailment.
Can you recollect how this type of data is represented? Yes, vectors!
Most real-world datasets have more than one variable. Examples include Natural Language Processing, images, and financial data. So, to predict the likely outcome, we use multivariate calculus to determine how each variable contributes to the solution.
4. Optimization
The concepts of maxima/minima are very important for optimization. It means to find a maximum/minimum of a function to obtain the most accurate value. Optimization techniques help you understand the internal working of an algorithm.
With the knowledge of optimization, you can get the desired accuracy faster, as you will know how to tune the parameters. With experience and more understanding of optimization, you will be able to develop new algorithms as well!
Let us see how the concepts of linear algebra, probability, calculus, and optimization are used for different machine learning algorithms:
- Logistic regression is based on the S curve or the Sigmoid function.
- PCA, the most popular dimensionality reduction algorithm, uses eigenvalue and eigenvector.
- Naïve Bayes and Bayes theorem use probability theory.
- Linear regression uses linear equations and matrices.
- Backpropagation in deep learning algorithms uses differential calculus. Same way, Gradient descent uses differential calculus.
- SVM uses vector dot product for maximization and matrix for kernel trick.
- The decision tree uses conditional probability to determine entropy and thus, the information gain.
Learning the required mathematics:
Many courses and books will help you do the mathematics for data science. If you pick up your high school books, you might be able to refresh some basics. However, it is best to start afresh with these courses:
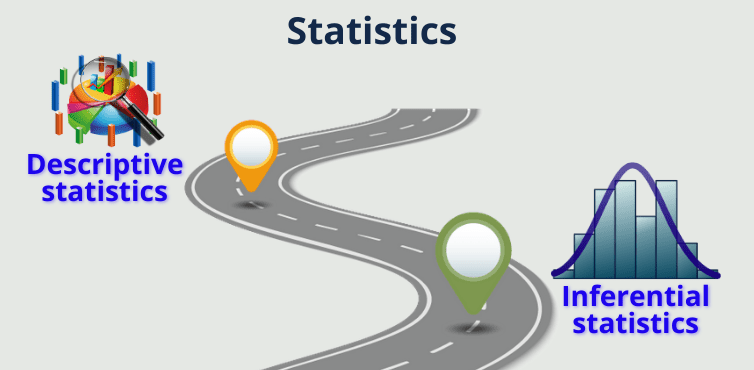
Step 2: Statistics
The next step in the data science roadmap is statistics. It involves collecting huge amounts of data for processing and analysis. This perfectly fits into the definition of data science.
Statistics gives an easy way to summarize, analyze and visualize data in various representations. Knowing the statistical formulae and how to use them helps in various stages of data science.
There are different types of statistics:
1. Descriptive Statistics
This is the simplest way of representing data. With descriptive statistics, we can get a basic understanding of data. For example, finding the mean, median, mode, central tendency, range, standard deviation, variance, and correlation. This type of basic analysis is the first step for quantitative data and can be easily visualized using graphs and charts.
2. Inferential Statistics
With inferential statistics, we take one step ahead and start making inferences from the results of the descriptive statistics. Inferential statistics is subjective and not as easy as descriptive statistics.
For example, suppose out of 100 people, a sample of 70 people is chosen, and they are asked to choose between two art designs A1 and A2. If 67 of them choose A1, we can then infer that about 67% of the population like A1. This is called hypothesis testing. The sample is described using descriptive statistics calculations.
Learn statistics through these resources:
- Statistics for Applications (MIT)
- Applied Statistics and Probability
- An introduction to statistics
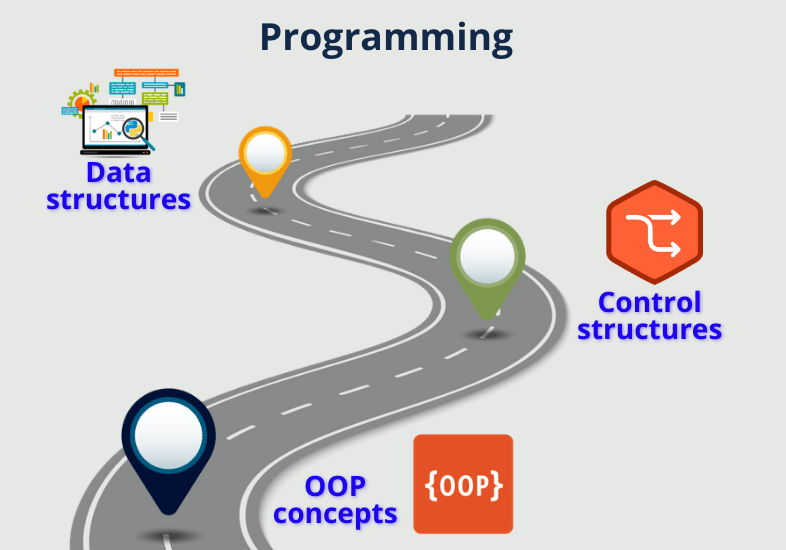
Step 3: Programming
Programming is the third step in the data science roadmap. From data processing to analysis and visualization, programming concepts and computing skills are essential for data science. You can perform simple tasks like iteration, sequencing, recognizing patterns, arranging data, and writing functions that will help break down a big problem into smaller sub-problems.
Some important aspects of programming you should know for data science (irrespective of the language) are:
1. Data Structures
It is very important to understand the concept of arrays, lists, maps, hashtable, set, graphs, and trees. Data structures hold huge volumes of data and have several functions for sorting, filtering, etc. making it easy to work with the data. Data structure knowledge is also a fundamental requirement for algorithms.
2. Control Structures
Control structures are important for the workflow of an application. For example, if you want to print a welcome message, only when a person is above the age of 18, you can put a check as:
if(age > 18){//print message}
Same way, if you want to print a special message for the first 5 website visitors, you can use a ‘for’ loop as:
// for first 5 visitors
for(int i=1; i<=5; i++){
// print the message
}
There are a lot of control structures that help you decide the workflow, like switch-case, while, and do-while.
3. OOP Concepts
For any programming language that you want to learn, OOP concepts form the base. Most languages are object-oriented and make it easy to store similar types of data. For example, an object ‘Student’ can store all the details of a student, such as a name, age, class, subjects, marks, hobbies, and parents’ names.
Watch this video for a quick review of OOP concepts .
Step 4: Languages
So, how do you learn the above concepts and practice them? You can choose any of the following programming languages R or Python, start practicing and continue the data science roadmap.
In my personal experience, Python is easier to understand and more readable. You can learn it quickly too. However, for more advanced users, R has better libraries and tools for data analysis and visualization.
1. Python
Python has a rich set of libraries, built particularly for data science. This is the most important reason why Python is much preferred for data science. If you have prior programming experience, learning Python will be a breeze for you.
If you don’t, learning Python will still be a breeze. The syntax is simple and understandable; all you need are logical thinking and problem-solving skills—check out our article on Python for data science to start learning Python.
2. R
Similar to Python, R is another powerful language that has some more features like structured data analysis and data visualization apart from rich libraries to solve complex problems. R treats data in the form of vectors, arrays, lists, matrices, factors, and data frames that make it easy for you to play with data and manipulate it.
Start learning the basic concepts of R for data science.
The language you choose for data science depends on a lot of factors, and both languages have their strengths and weaknesses.
Here is a nice article that compares both – R vs Python.
Programming concepts are used in every phase of data science. You might be able to quickly write a routine or task for performing cleaning tasks, which are mundane and repetitive, or you may write a sort program to sort the data on the fly.
If you know how to write code, you can save a lot of time doing things that will take a lot of time otherwise. Programming also helps in data analysis and visualization. You can also perform most of the statistics and mathematical operations using Python and R.
3. SQL
It is essential for data science. Writing queries, grouping data, selecting part of data, filtering, joining, merging, sorting, etc. can be easily done at the database level using SQL. Further, SQL can run scripts that can perform multiple tasks at once. It is used in data preparation, manipulation, and exploratory data analysis stages.
SQL for data science is a great start to learning all the SQL you need for data science.
You can also refer to the SQL for data analysis crash course for a quick understanding of SQL.
4. Java
Although for most purposes, Python and R are the preferred languages for data science, companies are also looking for Java as a good option because of many reasons, including:
- Java is object-oriented.
- It is robust and has applications in almost all domains.
- A lot of older applications used Java as the primary programming language as it simplifies integration and can be used with many platforms.
- Most big data frameworks like Hadoop, Spark, and Hive are written in Java.
- Java has rich and easy-to-understand libraries for machine learning (WEKA), statistical analysis, Natural Language Processing, data cleaning, data visualization, data mining, and data import and export.
- Java is powerful, scalable, strongly typed, and much more suitable for data science projects having strict deadlines.
If you already know Python, C, C#, or C++, Java will be easy to learn.
You can take up the Object-Oriented Programming in Java specialization from Coursera to get started with Java learning.
Step 5: Big Data
In the next step of the data science roadmap, we have big data. It is the unstructured and structured data that is received by firms each day. This data is huge in volume and raw. It cannot be used immediately and needs a lot of processing before it becomes fit for use. In fact, cleaning the data is the most difficult and time-consuming process in the entire data science lifecycle .
But before that, we need a stable data source to store this huge volume of dynamic data. Relational database systems are not flexible for storing unstructured data, and hence we need something more. That’s where Hadoop and Spark help us!
1. Apache Hadoop
Hadoop, in itself, is a vast topic having its ecosystem and a combination of many components that help store data in a distributed environment. It uses a programming model called MapReduce to process big data.
The main concepts you should familiarize yourself with are the Hadoop ecosystem, clusters, HDFS, MapReduce, Hive, Pig, and YARN. Start learning Hadoop through this short course on Hadoop from Udemy.
2. Apache Spark
Spark is a fast engine for large-scale data processing. It provides features like optimized query execution and in-memory caching. It follows an iterative approach for data handling and overcomes the limitations of MapReduce.
Some important concepts you should know in Spark are Spark Core, Spark SQL, Spark Streaming, Spark MLlib, and GraphX. Since Spark is a huge framework, having a book to learn (and for reference) will prove to be useful.
Spark: The definitive guide is the best book for learning, guidance, and reference. You will also be able to learn PySpark, which is the Python API for Spark.
3. NoSQL DB
As a data scientist, you should know about NoSQL databases. These databases store data in the form of a single data structure rather than multiple tables. For example, MongoDB, one of the most popular NoSQL databases, stores data as documents. The document directly maps to the objects.
Some other NoSQL databases are Cassandra, DynamoDB, ElasticSearch, and HBase (based on Hadoop HDFS).
Step 6: Data Wrangling
Up till now, we were defining the individual core skills. Once you are done with all the bits and pieces of learning, it is now time to combine the above core skills and put them to use in the below stages of data science.
Next in the data science roadmap is data wrangling. It includes transforming and mapping raw data into a more usable format. This way, the data becomes more valuable and fit for analytics.
1. Data Collection
Data collection requires extensive research because data has to be collected from various sources and then combined. Sometimes, data from multiple sources has to be merged. Data collection also includes skills like data cleaning, sorting, administration, and reporting.
2. Data Cleaning
Data cleaning is the most tedious and critical task out of all the data science phases. It includes treatment of missing values, outlier detection and correction, data validation, and removal of duplicates.
3. Data Manipulation
Data manipulation is extracting only the necessary data from a huge dataset. This is because not all the features and not all the values are fit to be included in the data. The data we need largely depends on the business problem that needs to be solved.
Data manipulation includes indexing, sorting, grouping, filtering, aggregation, subsetting, data merging, pivot tables, combining and creating new variables (features), and reshaping. Some good courses to take up are:
- Data Analysis with Python
- MicroMasters program in Data Science
- Data analysis using Excel
- Data manipulation with SQL
4. Data Visualization
Data visualization involves viewing data in the form of graphs and charts to understand its features easily and clearly. It also helps in viewing different combinations of features to see what set of parameters of data can best describe the data and the business problem.
You should be familiar with basic plots like histograms, scatter plots, line plots, bar charts, box plots, and heatmaps to start with. Excel is a great tool to start with visualization, and so is Tableau. You can easily set up Tableau and drag-and-drop parameters to see different visualizations.
Step 7: Cloud Computing

Cloud computing has become essential for big data analytics. Deploying data solutions and expanding computing power have become easier and faster with the cloud.
There are 3 major cloud providers in the market: Amazon AWS, Microsoft Azure, and Google Cloud. Each has its own set of powerful features, and it depends on the organization to decide which one to use.
As a data scientist, you should know the basic concepts like pipeline, scheduling and performing tasks in the pipeline, and using the toolkits provided by the platforms.
Step 8: Machine Learning
Machine learning is the next milestone in the data science roadmap. It is an important phase where machines try to find patterns and trends in the data and solve business problems using datasets.
1. Algorithms
A data scientist is expected to know the basics of algorithms, the purpose of each algorithm, the different types of algorithms, and so on. For example, what is the purpose of PCA, or how can we use kernel tricks, or what is reinforcement learning.
For more machine learning topics, click here .
2. Identifying the Type of Problems
This is not an essential skill but will give you an advantage over other candidates if you apply for an interview. If you have done a couple of projects and courses, you will be able to tell a bit about what is the best algorithm for a particular problem.
For example, if we want to know “whether to take up a course or not?”, which depends on factors like availability of seats, finance, location, safety, etc., a decision tree will be a good choice. Same way, to determine if an email is spam or not, Naïve Bayes is the most suitable, and so on.
3. Identifying the Issues with Data
Once the machine learning algorithm builds the model, it has to be evaluated. The model can be over-fitting or under-fitting. The dataset itself may be imbalanced. You should also know about the model evaluation techniques.
For example, for classification, there are many metrics to evaluate the model: accuracy, precision, and recall.
Learn more about these parameters in this Google Machine learning crash course .
4. Deep Learning
Once you have a fair idea of machine learning, you can get into the basics of deep learning. If you are from an engineering background, you might have already studied a few neural networks and fuzzy logic. Even if you are not, there is nothing to worry about. These are slightly advanced topics and are generally learned with experience.
If you wish to learn the basics, you can start by watching this YouTube video .
Step 9: GitHub
 If you have heard of GitHub, you might be thinking, why do we have to mention a version management system in a data science roadmap?
GitHub has no direct relation with data science, but knowing GitHub will help you build better code through various forums and connect you to experts in the field. It is a repository hosting service that provides basic task and version management for projects. Since GitHub is open-source, it has a huge community of millions of programmers who can view and review each other’s works.
Step 10: Data Science Projects
Now that we have put all the core learning pieces together, in the next step of the data science roadmap, we have to learn and develop projects. There are many projects already available through courses and tutorials, and you should look at them to understand how these work. However, after that, try to create your own project to get the real feel of data science.
1. Movie Recommendation System

This is a very popular use case of data science. You must be watching YouTube videos, Netflix, etc. When you watch a particular set of videos, you get similar kinds of recommendations the next time on.
How? That’s through movie recommendation systems that work based on comparing a user’s preferences with the preferences of users who have similar interests. The movie recommendation system is based on collaborative filtering.
2. Chatbot

The chatbot is an AI-based intelligent software that interacts with humans to solve common problems in a natural human language. Chatbots can be rule-based or self-learning bots. Chatbots are one of the best use cases and are very popular nowadays.
So, it would be a good project to take on.
3. Text Mining
Text mining is a process in which text from users is analyzed to identify their sentiments or other insights. For example, if a customer reviews a certain product, from the tone of the text and usage of certain words, text mining can determine what the customer feels about the product. It is used in many domains like manufacturing, retail, healthcare, telecom, and insurance.
Check out the project here .
4. Create Your Own Project
Once you get the hang of a few existing projects, you should try some of your own too. You can download datasets from free websites and create any problem of your choice. There are a lot of open forums like GitHub and StackOverflow, so even if you are stuck, you can get a lot of help from there.
Some examples of simple projects you can work on are:
- Eating patterns of people in your community – For example, how many people prefer eating outside food often, and what are the days when most people order outside food?
- In what ways do people keep themselves healthy? – Exercise, gym, yoga, and/or diet? What is the percentage of healthy vs unhealthy people?
- How COVID-19 is changing people’s lifestyle choices?
Step 11: Data Science Tools
Along the way, while learning the other skills, you would have come across many tools used for data science.
In the next step of the data science roadmap, we talk about data science tools. Tools make it easy for developers to concentrate on business logic as they can do most of the math and statistics. You do not have to master all the tools yet, but knowing a bit about them won’t hurt.
Read an overview of data science tools .
Step 12: Challenges and Competitions
Taking part in online challenges and competitions will boost your confidence and help you build a network. You can learn a lot from these challenges.
Some popular websites that host such challenges are:
Step 13: Interview Preparation
This is the last step in the data science roadmap. By this time, you should be confident enough and thorough with at least a few concepts in data science. If you have done a few projects, you should brush up on the topics before the interview.
Generally, a data scientist is interviewed for both data science as well as machine learning concepts, so you should be clear with both. Here are some resources to refresh your knowledge:
The Road Ahead
That’s it for this article on the data science roadmap guys! Before I end, there is an important note - along with all the skills above, you should also get the knack of strategic management, i.e. once you get the insights from data, you should be able to convert them into workable actions. That is when the full potential of data analysis and the whole purpose of data science will be fulfilled.
I hope you have now enough information to kick-start your data science journey. The most important part of data science is cleaning the raw data, so you should practice that as much as possible.
Another big hurdle you will face with the data is feature selection, which will not come easily. Out of 1,000 features, you will need to select a few important ones, because the rest will be redundant. Though there are methods and techniques for it, it mostly depends on the capability of the data scientist. This is where the creative, out-of-the-box, problem-solving skills (that you must have read everywhere) will come into the picture.
Start learning today, and master each topic at your pace!
People are also reading:
- Top Data Science Skills
- Data Science for Beginners
- Data Science Roadmap
- Principal Component Analysis (PCA)
- Top Data Science Programming Languages
- Data Science vs Machine Learning
- Best Machine Learning Books
- How to Become a Machine Learning Engineer?
- What are Statistics and Probability?
- Best Data Science Books


Leave a Comment on this Post