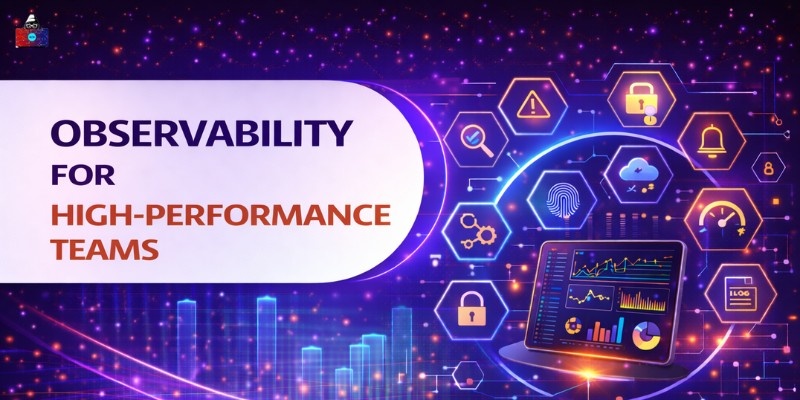

Modern tech environments are more complex than ever, spanning hybrid infrastructure, microservices, and distributed systems. Observability helps teams understand what’s happening across their entire stack in real time. Teams can detect problems early, improve reliability, and deliver better user experiences. Below are nine essential observability features, along with leading platforms that excel in each area.
1. Unified Infrastructure Visibility with SolarWinds
A unified view of your infrastructure is the foundation of observability. Tools like SolarWinds provide comprehensive visibility into networks, servers, applications, and cloud resources within a single interface. This centralized perspective allows teams to quickly understand dependencies and pinpoint issues.
This level of visibility strengthens Network Performance Monitoring, helping teams identify bandwidth bottlenecks, failing hardware, or misconfigured devices before they impact users.
2. AI-Driven Root Cause Analysis with Dynatrace
AI-powered observability platforms automatically analyze system behavior and identify root causes of performance issues. Dynatrace uses intelligent automation to detect anomalies and correlate data across services.
This is especially valuable for Application Monitoring, where complex microservices architectures can make troubleshooting difficult. AI accelerates incident resolution and reduces downtime.
3. Automated Alerting and Threshold Management with Splunk
Alerting ensures teams are notified immediately when something goes wrong. Splunk enables teams to configure dynamic alerts based on metrics, logs, and events.
Effective alerting improves Server Monitoring, allowing teams to respond quickly to CPU spikes, memory issues, or storage failures before they escalate into major outages.
4. Real-Time Network Performance Tracking with ManageEngine
Real-time tracking is essential for maintaining reliable connectivity. ManageEngine offers detailed monitoring of routers, switches, and network traffic, helping teams identify slowdowns instantly.
Strong Network Monitoring capabilities ensure consistent performance across internal and external infrastructure, improving uptime and user satisfaction.
5. Scalable Cloud Infrastructure Monitoring with LogicMonitor
As organizations scale their cloud environments, observability tools must scale with them. LogicMonitor delivers flexible Cloud Monitoring across multi-cloud and hybrid setups.
This ensures that teams can track performance, resource usage, and availability as infrastructure grows, without sacrificing visibility or control.
6. Custom Metrics and Data Flexibility with Prometheus
Prometheus allows teams to define custom metrics tailored to their specific workloads. This flexibility makes it ideal for containerized environments and Kubernetes deployments.
Custom metrics enhance Application Monitoring by giving teams deeper insights into service performance and behavior beyond basic system metrics.
7. Powerful Visualization and Dashboards with Grafana
Visualization makes complex data easier to understand. Grafana provides customizable dashboards that display metrics, logs, and trends in clear visual formats.
This improves both Network Performance Monitoring and overall system observability by helping teams quickly identify anomalies and trends.
8. Distributed Tracing Across Services
Distributed tracing allows teams to follow requests as they move through multiple services. This is essential for modern applications built on microservices and APIs.
Tracing improves troubleshooting by revealing performance bottlenecks and latency issues across interconnected systems, strengthening overall observability.
9. Log Aggregation and Correlation
Logs provide detailed records of system activity. Observability platforms that aggregate logs into a centralized location make it easier to detect patterns, errors, and unusual behavior.
When combined with metrics and traces, logs provide a complete picture of system health, enabling faster and more accurate troubleshooting.
Building a Strong Observability Foundation
Observability is no longer optional for modern tech teams. Features like unified visibility, AI-driven analysis, customizable metrics, and real-time alerting empower teams to maintain high performance and reliability. By implementing platforms that support comprehensive Server Monitoring, Cloud Monitoring, and Network Monitoring, organizations can ensure they stay ahead of problems, reduce downtime, and deliver consistent digital experiences.