

Right today, both data science and data analytics are thriving industries. Naturally, job prospects in these industries are expanding fast. The best thing about pursuing a career in data science is the variety of options available. Having the basic minimum qualifications, on the other hand, is insufficient for these positions.
You must pass the most important test – the interview. Not to worry, we've put together this list of top 10 data analyst interview questions and answers to help you understand the concepts better and ace the interview.
Top Data Analyst Interview Questions and Answers
1. What are the responsibilities of a Data Analyst?
- Obtaining data from primary and secondary sources and maintaining the database.
- Filtering, cleaning, monitoring & auditing the data.
- Interpret and analyze the data using various statistical techniques.
- Generate easy-to-understand reports.
- Collaboration and coordination with others.
2. Define "Data Wrangling" in Data Analytics.
Data wrangling is the process of cleaning, structuring, and enriching raw data so that it may be used to make better decisions. Discovering, structuring, cleaning, enriching, validating, and analyzing data are all part of the process.
This method can transform and map enormous amounts of data gathered from diverse sources into a more usable format. The data is analyzed using techniques such as integrating, grouping, concatenating, combining, and sorting. After that, it's ready to utilize with another dataset.
3. What are the Common Problems Faced by Data Analysts?
a) There are duplicate entries and spelling mistakes. These inaccuracies might obstruct and decrease data quality.
b) Data of poor quality obtained from untrustworthy sources. A Data Analyst will have to spend a significant amount of time cleansing the data in this case.
C) Another significant challenge in the data analysis process is incomplete data. It would inevitably result in incorrect or faulty results.
4. What is MapReduce?
MapReduce is a framework that allows you to develop applications that handle big data sets by dividing them into subsets, computing each subset on a separate server, and then combining the results from each. It is divided into two parts: Map and Reduce. Reduce conducts a summary function, whereas map does filtering and sorting.
5. What is the Difference Between Data Capturing and Data Mining?
|
Data capturing |
Data mining |
|
It is the process of gathering data from numerous sources in various forms and converting it into a readable format using various software programs. |
In data mining, useful information is extracted from the data which has been captured, which is the information that can be used for forecasting and making other important business decisions. It is also known as a knowledge discovery process. |
6. What is Data Cleaning, and What are the Most Effective Methods for it?
The process of finding and resolving corrupt, erroneous, or irrelevant data is known as data cleansing. The important stage of data processing, also known as data scrubbing or data cleaning, enhances the consistency, dependability, and usability of a company's data.
The most effective techniques for cleaning data are:-
- Create a data cleaning plan by identifying common errors and keeping all lines of communication open.
- Identify and delete duplicates before dealing with the data. As a result, data analysis will be simple and effective.
- Concentrate on data accuracy, set cross-field validation, keep data types consistent, and enforce required constraints.
- To make the data less chaotic, normalize it at the entry point. You'll be able to confirm that all data is consistent, resulting in fewer data entry errors.
7. What is Data Profiling?
- Data profiling is also known as Data assessment and Data Archaeology.
- Its main objective is to check the correctness, completeness & consistency of data and ensure that it is free from any anomalies.
- During the process, it is also checked that the data follow business rules. Hence, there should be no violation of business rules.
8. What Various Steps are Involved in any Analytics Project?
This is one of the most fundamental data analyst interview questions. The following are the various steps involved in any typical analytics project:
- Understanding the Issue: Understanding the business dilemma, establishing organizational goals, and devising a profitable solution.
- Data Collection: Gather the necessary data and information from different sources based on your priorities.
- Data Cleaning: Clean the data to erase any unwanted, redundant, or missing values before analyzing it.
- Data Exploration and Analysis: To analyze data, use data visualization and business intelligence tools , data mining techniques, and predictive modeling.
- Results Interpretation: Interpret the findings to uncover hidden patterns, forecast future trends, and gain insights.
9. What are the Technical Tools You've Used for Analysis and Presentation?
As a data analyst, you should be familiar with the tools listed below for analysis and presentation.
- MySQL and MS SQL Server- For working with relational database data.
- Tableau, Microsoft Excel- To generate reports and dashboards.
- SPSS, R, and Python- For statistical and data modeling purposes, as well as exploratory analysis
- MS PowerPoint- For representing and displaying the end results.
10. What is an Outlier?
A statistic in a sample that appears to be far separated and deviated from a set pattern is referred to as an outlier by data analysts. There are two sorts of outliers: Univariate and Multivariate.
The two methods for detecting outliers are as follows:
- Box plot method – An outlier is defined as a value that is greater or less than 1.5*IQR (interquartile range), such that it is above the upper quartile (Q3) or below the lower quartile (Q1).
- The standard deviation method - It states that an outlier exists if a value is greater or less than the mean (3*standard deviation).
11. What is KNN Imputation Method?
KNN involves the values of missing attributes using the value of those attributes that are near to the missing ones. The common thing between these two attributes is defined by using the distance function.
12. What Happen When There’s Missing Or Suspected Data?
At the time of missing or suspected data, a data analyst must:
- Use data analysis strategies like the single imputation method, deletion method, and other model-based methods to identify the missing data.
- Get a validation report that contains information about the suspected or missing data.
- Replace the invalid data with the proper code
- Scrutinize the suspicious data to ensure its validity
13. What are the Different Types of Data Validation Methods Used By Data Analysts?
There are many ways to validate the dataset, some of the common ones are:
- Form Level Validation: In this method, the data is validated once the user completes and submits the form. This method validates the entire data entry form in one go and ensures that all the fields are correct.
- Field level validation: In this, the data is validated in every field. It helps in correcting the errors as you keep on checking.
- Data Saving Validation: This technique is used during the time of the process of saving the actual file. It is usually done when various data forms should be validated.
- Search Criteria Validation: This technique is used to provide the users with accurate and related matches for their searched keywords or phrases. This method also ensures that the user’s search queries show the appropriate results.
14. What is Clustering? What are the Properties of a Clustering Algorithm?
Clustering is a method where the data is classified into groups and clusters. It has the following properties:
- Hard and soft
- Disjunctive
- Iterative
- Hierarchical or flat
15. How to Deal With Multi-Source Problems?
To deal with multisource problems, you need to:
- First, identify the data records to combine them into one record. This one record will contain all the useful things with no redundancies.
- Include schema integration through the schema restructuring
16. What Do You Mean By K-Mean Algorithm?
K-mean is a partitioning method where the objects are classified into K-groups. In this algorithm, the clusters are spherical in shape with data points aligned in the cluster and the variance is similar to each other.
17. What is the Difference Between Data Mining and Data Profiling?
Data Profiling Process involves analyzing the data’s unique attributes. In this mining, the emphasis is on providing useful information on each data attribute like frequency, data type, and more.
Data mining involves analyzing data to identify relations which are not been discovered previously. In this mining, the emphasis is on identifying unusual records, analyzing clusters, detecting dependencies, and more.
|
Data Mining |
Data Profiling |
|
It includes analyzing the pre-built database to identify various patterns. |
It includes analyzing raw data from existing data sets. |
|
It analyzes the database to convert raw data into something useful. |
In this, informative or statistical summaries of data are gathered. |
|
It includes finding the hidden patterns and seeking new, non-trivial data to collect useful information. |
It involves evaluating data sets to ensure uniqueness, logic, and consistency. |
|
It cannot identify inaccurate or incorrect data values. |
Data is identified at its initial stage of analysis. |
18. What is Outlier in Datasets?
An outlier is a value that is different from the mean of characteristic features of a dataset. By using the outlier, you can identify variability in the measurements or can easily identify the experimental error.
19. What is the Difference Between Data Analysis and Data Mining?
|
Data Analysis |
Data Mining |
|
It helps analyze the data and provides the hypotheses. |
A hidden pattern is shown and discovered in the large datasets. |
|
It includes collecting, preparing, and modeling data to get insights. |
It is just an activity in the data analysis process. |
|
Data-driven decisions are made through this. |
Data usability is the prime objective. |
|
Visualization is required. |
Visualization is not required. |
|
Here, datasets can be large, medium, or small, and can be structured, semi-structured, or unstructured. |
Datasets are usually large and structured. |
20. What is Normal Distributing?
Also called Gauss Distribution, normal distribution plays a key role in statistics as well as in machine learning. It includes measures on how the value of variables is different in their standard deviations and how the values are distributed.
21. What is Hash Table?
A hash table is defined as a data structure that stores data in the array format. This stored data allow each data value to be unique. Using the hash technique, a hash table generates the index into the array slots through which you can retrieve different values.
22. What is Clustering Algorithm? What are the Different Properties of Clustering Algorithms?
Clustering is the process of categorizing data into various groups and clusters. In clustering, sets of objects that are packed in the same cluster are similar to each other. Clustering can either be hard or soft, iterative, disjunctive, flat, or hierarchical.
23. What Do You Mean by Pivot Table? Where is it Used?
A pivot table is one of the most common tools for data analysis. It lets you summarize huge datasets in Microsoft Excel. Using this table, you can interchange groups and columns.
Also, it allows you to group any field or column by applying advanced calculations. Pivot table comprises four different sections:
- Row Area: These are the headings placed at the left of the values
- Value Area: Here values are reported
- Column area: The headings above the value area are the column area
- Filter Area: This is used to drill down the data set
24. What is Hierarchical Clustering?
Hierarchical clustering is all about grouping objects into clusters that share the same properties. It is divided into two parts:
Agglomerative clustering, which uses a bottom-up strategy to destroy clusters.
Divisive Clustering, which uses a top-down strategy to break clusters.
25. What is N-gram?
N-gram, also called the probabilistic language model, is defined as the sequence of n-connected items in a specific text or speech. It comprises of adjacent words and letters that are present in the source text. In simple terms, N-grams help predicts the next value of the sequence.
26. What are the various steps involved in the analytics project?
Some of the common steps involved in any analytics project are:
- Understanding the Issue : To understand the issue, you need to understand the goals.
- Gathering data: Collect data from different resources depending upon your priorities.
- Cleaning data: This includes cleaning data to remove missing, unwanted, and redundant values to make it appropriate for the analysis.
- Exploring and analyzing: Use data visualization and some business intelligence tools, predictive modeling, and data mining techniques.
- Interpreting the Results: Identifying the hidden patterns and gaining insights and future trends.
27. What do you understand by Exploratory Data Analysis (EDA)?
- EAD helps to understand the data better.
- It ensures that you can include a machine-learning algorithm in your data.
- It allows you to refine your selection, which can be used later for the model building.
- You can identify the hidden trends and insights from the data.
28. What do you mean by predictive, descriptive, and prescriptive analysis?
- Descriptive analysis: It gives insight into the things that have happened in the past. It uses data aggregation and data mining techniques to get an analysis of the data. It uses data mining and data aggregation techniques.
- Predictive Analysis : Predictive analysis is all about predicting things that come in the future. It uses statistical models and forecasting techniques.
- Perceptive model: This model suggests different courses of action to the answer, like what you should do for your business. This analysis uses optimization and simulation algorithm optimization techniques to achieve the possible outcomes.
29. What do you mean by sampling?
Sampling is a statistical model that is used to select the subset of data from the different datasets to estimate the characteristics of a complete business.
30. What are the different types of sampling techniques that are used by data analysts?
There are five major types of sampling methods:
- Systematic sampling
- Cluster sampling
- Stratified sampling
- Judgmental or purposive sampling
- Simple random sampling
31. How to handle missing values in the dataset?
There are four different methods of handling the missing values in a dataset, the most common of them are as follows:
- Average imputation : In this, you can take the average sum of the response of other participants and fill in the missing values.
- Listwise Deletion : In this method, the complete record is removed from the analysis, even if a single value is missing.
- Regression Substitution: You can use various regression analyses to estimate the missing value.
- Multiple imputations: It helps in creating plausible values based on the correlation between missing the data and the average of datasets by including random errors in your predictions.
32. What is Time Series Analysis?
Time series analysis is a statistical procedure that deals with the specific ordered sequence of different values at specific time intervals. Time series data is collected at different periods so that there is a correlation between different observations.
33. How is underfitting different from overfitting?
|
Overfitting |
Underfitting |
|
This model helps train the data by using the training set. |
The model can neither train the data nor generalize the new data. |
|
The performance drops over the test set. |
Perform poorly when it comes to training the test set. |
|
This occurs when there are random fluctuations and noise. |
This happens when there is limited data to create an accurate model. |
34. What Do You Mean by Hypothesis Testing?
Hypothesis testing is a procedure used by scientists and statisticians to accept/reject the statistical hypothesis. Hypothesis testing is of two types:
- · Null hypothesis: It shows no relationship between the outcome and the predictor variable in the population. It is denoted by H0.
- · Alternative hypothesis: It shows that there is some relationship between the outcome and predictor variable. It is denoted by H1.
35. What are Type I and Type II errors?
Type I errors occur when the null hypothesis is not accepted; this type of error is called a false positive.
Type II errors happen when the null hypothesis is not rejected; this is also called a false negative.
36. How do you make a dropdown list in MS Excel?
To make the dropdown, you need to:
- Click on the Data tab, which is present in the ribbon.
- Select the Data Validation from the Data Tools group.
- Go to Settings>Allow>list
- Select the source that you want to provide with a list array.
37. Can you give the dynamic range in “Data Source” for a pivot table?
Yes, to provide a dynamic range in ‘Data Source,’ you need to create a name using the offset function, and the base by using the names range built using the first step.
38. Which function is used to find the day of the week of any specific data value?
To get the day of the week, you can use the WEEKDAY() function.
39. How did VLOOKUP work in Excel?
VLOOKUP is used when you need to find things that are present in a table or a row. It accepts the following parameters:
- Lookup_value: This is where you can look at the value in the first column of the table.
- Table: You can extract the values from here.
- Col_index: This column is used to extract the values.
- Range_lookup: [optional] value=approx. match (default).False= exact match
40. What is the difference between the WHERE and HAVING clause in SQL?
|
WHERE |
HAVING |
|
This clause operates on the raw data. |
It operates on aggregated data. |
|
In this, the filter applies before any grouping. |
It is used to filter values from a group. |
|
Aggregate functions cannot be used in this. |
You can use aggregated functions. |
41. What do you mean by Subquery in SQL?
Also called a nested query or inner query, a Subquery is a query in another query. These are used to enhance the data to be queried in the prime query. A subquery is of two types, namely correlated and non-correlated query.
Example:
Here’s a query that returns the name, phone number, and email id of a student from Texas city.
From Student

WHERE stu_id IN(

 SELECT std_id

From employee

WHERE city =’ TEXAS’);
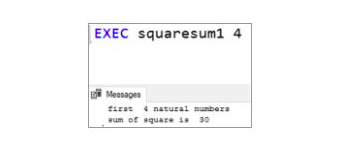
42. How do you write a stored procedure in SQL?
Let’s discuss this with an example:
- Create a procedure by assigning a name, like squaresum1.
- Now, declare variables.
- Write the formula by using a set statement.
- Now, print the values of the computed variables.
- Use the EXEC command to run the stored procedure.
Output : Display the sum of the square for the first four natural numbers.
43. What do you mean by the LOD in Tableau?
LOD in Tableau represents Level of Detail; it’s an expression that you can use to execute complex queries that involve different dimensions at the data sourcing levels. Through LOD, you can identify the duplicate values, create a bin on aggregated data and synchronize chart axes.
44. What are the different connection types in Tableau software?
Connections in Tableau are of two types:
- Extract: Extract connection is an image of data that is extracted from the data source and is placed in the tableau repository.
- Live: The live connection helps make a direct connection with the data source. The data in this is fetched straight from the tables so that it is consistent and always up to date.
45. What kind of joins does Tableau provide?
Joins in Tableau are the same as SQL join statements. The joins that Tableau support are as follows:
- Left outer join
- Right outer join
- Full Outer Join
- Inner Join
46. What is Gantt Chart Tableau?
A Gantt chart in Tableau shows the progress of the value over a specific period, i.e., it helps show the duration of the event. A Gantt chart consists of bars placed along the time axis. This tool is mostly used as a project management tool where the bar is a measure of the task of the project.
47. What is the difference between Treemap and Heatmap in Tableau?
|
Treemap |
Heatmap |
|
It is used to display data in the nested technique. |
Heatmap can be used to measure against the dimensions with the help of size and colors to differentiate one or more dimensions. |
|
You can use dimensions to define the structure of the treemap and measure the size or color of the individual rectangles. |
It’s the text table with variations in the values encoded as colors. |
|
Treemaps are simple data visualization to provide insights in a visually attractive format. |
In this, you can see a lot of information. |
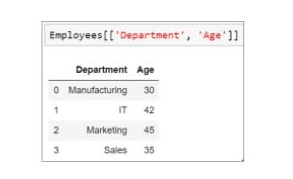
48. How would you pick the Department and Age columns from an Employee data frame?
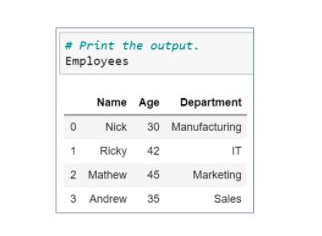
You can use column names to extract the specific columns as shown below.
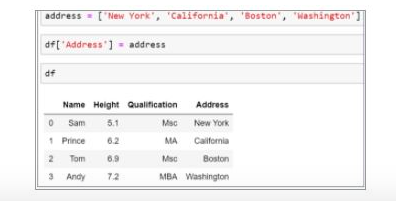
49. How can you add a column to the Panda Data Frame?
Suppose there is an emp data frame that has information about some employees. Let’s see how to add an address column in the data frame:
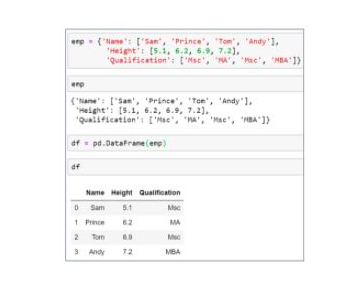
Declare the list of values that are converted into the address column.
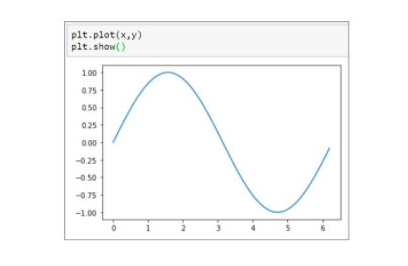
50. Can you draw a line graph by using a NumPy and Matplotlib library in Python?
Yes, here's the table:
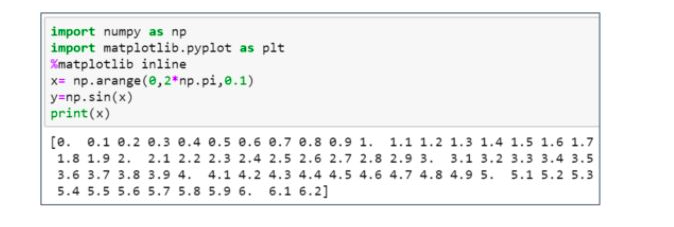
Here’s the sine graph:
51. How to print four random integers between 1 and 15 by using NumPy?
To get Random numbers by using the NumPy, you can use random.randint() function.
52. What function would you use to get the current date and time in Excel?
In Excel, you can use NOW() and TODAY () to get the current time and date.
53. How would you choose between a relational database and a NoSQL database for an analytics solution?
Picking a database? Think about how your data looks, what kind of questions you’ll ask it, and also how big it might grow. Old-school table-based systems work well when info is neat and predictable, plus you need solid accuracy across transactions. On the flip side, NoSQL handles messy, fast-growing data better, which is great for apps that chew through loads of varied records in real time, especially if spreading the load across servers matters more than rigid rules.
54. Explain the difference between time-series data and cross-sectional data. Why does it matter for analysis?
Time-series data tracks the same entities over time (e.g., daily website traffic). Cross-sectional data captures many entities at one point in time (e.g., survey responses from users this month). Knowing the difference matters for choosing methods (autocorrelation and trend analysis for time series; regression and clustering for cross-sectional).
55. What is drift in data, and how do you detect and handle it?
Data drift occurs when the distribution of incoming data changes over time (features, target variable, etc.), which can invalidate previously built models or analyses. Detect drift using statistical tests (e.g., the KS test), monitoring metrics, or comparing features over time. Handle it by retraining models, updating assumptions, or redesigning feature pipelines.
56. How would you measure the impact of a data quality issue on a key business metric?
You figure out the effect by guessing how badly wrong data skews the number. First, pull out the messed-up entries, build a fixed "how-it-was-supposed-to-look" set, then check this fix against the old result, and pin down how far off it was, while also looking at how it changed choices or key results later on.
57. Describe a scenario where ANOVA (Analysis of Variance) is more appropriate than a t-test.
ANOVA works better if you're checking averages from three or more groups at the same time. Say you’re looking into customer happiness across four different locations ANOVA checks them all together, which skips doing several t-tests and lowers chances of mistakes.
58. How would you design a dashboard for executives showing product performance? What metrics and design principles would you apply?
Leaders want dashboards they can grasp fast, clear visuals, and minimal fuss. Dump the focus on key stuff: overall sales, how fast you’re growing, who sticks around, fresh sign-ups, best sellers, and profit per unit, along with predictions. Use measures that tie straight to goals instead of vague ones, skip wordy descriptions, go with matching color schemes, split info into clear sections, place major figures up front, trends near the center, and fine print down low. Display changes over weeks or months, not just single moments; spot odd jumps without help; allow sorting by time or type. Keep it neat; ensure it works well on phones.
59. What is a window function in SQL, and when would you use it for analytics?
A window function in SQL handles connected rows without merging them, whereas GROUP BY combines entries into single results. Instead of summing things up, it shows patterns like ongoing sums or position levels. You can spot shifts across periods by comparing past values with present ones at the same time. This way, you see gradual shifts in averages or where a value stands percentile-wise. While processing data, each line keeps its shape. So, you spot small stuff as changes unfold across the whole view.
60. Explain how you would approach feature selection for a predictive model when you have 100+ features.
Blend field smarts with data checks plus clever modeling moves. Ditch anything pointless or doubled first; go with your topic insight while testing how variables connect. After that, bring in quick screening tools, such as cutting low-variance items, measuring ties to the outcome, or running chi-squared tests. Instead of just stopping there, go further using tactics like forward-backward picks, L1 penalties (that’s Lasso), or rankings from decision trees to shrink the list. Wrap up by testing selections through cross-checking folds so your final group actually boosts accuracy without falling apart on new data.
61. What is multicollinearity, and why is it a problem in regression analysis? How do you detect and remedy it?
Multicollinearity occurs when predictor variables are highly correlated, making it difficult to isolate individual effects and leading to unstable coefficient estimates. Detect it via variance inflation factor (VIF) or condition number. Remedy by removing or combining correlated variables, using principal component analysis (PCA), or regularization (ridge regression).
62. How would you handle a situation where your data analysis reveals a negative result for your stakeholder’s hypothesis?
I'd share the bad news straight up but in a helpful way. Right off, laying out the results with proof while walking through how we got there keeps things honest. Instead of calling it a dead end, call it learning what’s not working, which saves time later on. Toss in some different ideas, extra checks, or fresh angles so talk moves forward instead of shutting down.
Conclusion
That brings us to the end of our data analyst interview questions and answers guide. Even though these data analyst interview questions were chosen from a large pool of possible questions, they are the ones you will most likely face if you are an aspiring data analyst. These questions set the backbone of any data analyst interview, and knowing the answers to them will get you a long way.
Good luck!
People are also reading: