

On average, a machine learning engineer having about 5 to 7 years of experience earns about $134,756 yearly. ML engineers are in high demand and will be more as artificial intelligence technologies evolve in the years to come. This blog discusses the best machine learning interview questions to crack an ML interview in 2022.
What is Machine Learning?
Machine learning is one of the top career options right now. If you have good knowledge of ML algorithms, you can easily move on to becoming a data scientist . Machine learning requires good technical knowledge and expertise in mathematics, statistics, and probability.
You should also possess good problem-solving and analytical skills and the aptitude to analyze and solve complex problems. Machine learning is vast. However, the fundamental concepts remain the same.
In our article, we have listed some very common questions asked in machine learning interviews that help interviewers understand a candidate's level of knowledge as well as an aptitude for the subject. Other than purely technical questions, you may expect some subjective questions like:
- Why have you chosen machine learning and not data science as your career?
- Which, according to you, is the most preferred language for machine learning and why?
- Mention the projects or models you have previously built based on machine learning algorithms.
- If you have done any courses or certifications, they may ask you a little about neural networks and deep learning as well.
If you have previously done any ML projects , tell the interviewer(s) about your experience, problems faced, steps you took to solve the challenges, languages, and tools used, and so on.
Top Machine Learning Interview Questions and Answers
Let us now dive into machine learning interview questions that you may expect in most machine learning interviews:
Beginner-Level Machine Learning Interview Questions
1. What is machine learning? Why is it important?
Answer: Machine learning is the ability of a machine to learn and identify patterns by itself, just like a human brain. Machines are fed with data sets and algorithms to build and train models to produce highly accurate outcomes.
For example, to find what kind of movies are more popular among people of a particular age group, we can feed data into machines to identify the similarities in the genres of movies people of a particular age group watch. Machine learning algorithms will then learn through the data, build a model, and improve it with more iterations.
Machine learning is important because:
- It is more accurate than human (manual) processing.
- It saves a lot of effort, resources, and cost.
- The automated system can process a large number of customer requests that have similar queries.
- Machines can take care of monotonous jobs helping businesses focus on business logic and other important matters.
2. What are the three types of ML algorithms?
Answer: The three basic types of machine learning algorithms are supervised learning, unsupervised learning, and reinforcement learning.
3. How do you differentiate between classification and regression methods?
Answer: Both regression and classification are supervised machine learning types. Some differences are –
| Regression | Classification |
| The output variable is a numerical or continuous value, like a quantity or size. | The output variable is a category and not a quantitative value. |
| For example, predicting the age of a person and the price of a house. | For example, determining whether a person will purchase a certain product and whether sales will increase or decrease in the next quarter. |
| Some regression algorithms are linear regression, regression trees, and SVM. | Examples of classification algorithms include logistic regression, Naïve Bayes, KNN, and decision trees. |
4. What will you do to ensure that your model is not overfitting?
Answer: Here are a few ways:
- Don’t introduce too many input variables and parameters.
- Use cross-validation technique, i.e., training the model on a part of the data set and reserving the rest for testing.
- Regularization, i.e., adding a penalty in the error function so that the coefficients do not take any extreme values, thus reducing noise components.
- Through bias-variance trade-off, i.e., obtaining the optimal value of bias and variance. Low bias and high variance can cause overfitting, so reducing the variance and increasing the bias will help.
5. If your model is underfitting, what can you do to correct the model?
Answer: Underfitting happens when the model is too simple or does not take into consideration all the essential variables. This can happen when the amount of data provided is too little. We can take care of underfitting by:
- Increasing the training time for the model.
- Increasing the data supplied to train the model.
- Providing more parameters and input variables, thus increasing the complexity of the model.
6. What is the naïve Bayes theorem? What are its disadvantages?
Answer: Naïve Bayes is a classification algorithm, which is mainly used for text classification using high-dimensional training data. Some common uses for Naïve Bayes are spam filters, classification of news items, and sentiment analysis.
The equation to calculate the posterior probability is:
P(B/A) = P(A/B)*P(B)/P(A)
Here, P(A) is the probability of A to be true, P(B) is the probability of B to be true, and P(A/B) is the probability of A to be true if B is already proven to be true. The algorithm is very powerful, but it has some disadvantages, which are:
- Loss of accuracy because of the assumptions of other features being independent.
- Data scarcity.
7. What is the meaning of ‘Naïve’ is naïve Bayes theorem?
Answer: The naïve Bayes is called naïve because it assumes that the occurrence of one feature is independent of the occurrence of other features (predictors). In other words, conditional probability is the pure product of individual probabilities, which in real life is not always possible. For example, if you like chocolate and chili, as per naïve Bayes, you should like “chili-chocolate” as well, which is practically incorrect.
8. How is machine learning different from deep learning?
Answer: Both ML and deep learning are branches of AI. Here are some of the differences between the two:
| Machine learning | Deep learning |
| In machine learning, we can train models with less data. | DL requires a huge dataset to train the model. |
| The accuracy may or may not be high. | It provides high accuracy. |
| It is difficult to improvise and tune the model. | In deep learning, you can tune the model in various ways. |
| The training time for the model is less. | Deep learning requires more training time as it is data-intensive. |
| Three types of ML algorithms are supervised, unsupervised, and reinforcement. | Deep learning works on neural networks consisting of three layers, input, hidden, and output. |
| Some common machine learning algorithms are clustering, classification, and regression. | Some examples of DL algorithms are convolutional neural networks (CNN) and recurrent neural networks (RNN). |
9. Mention some of the important applications of machine learning.
Answer: Some of the most relatable ML applications are:
- Recommender Systems – Movie and product recommendations by sites like Netflix and Amazon, respectively, are the most popular ML applications. Netflix recommends movies to a user based on the preferences of other similar users as well as previous preferences of the particular user. Same way, Amazon recommends similar products based on the user's browsing patterns and the items other people bought along with a particular item.
- Voice Assistants – Voice assistants like Alexa, Cortana, and Siri use speech recognition, which is nothing but a translation of words into text. These assistants can play music, set reminders, task lists, set appointments, and so on.
- Image Recognition – Facebook face tagging is a good example of image (face) recognition. Same way, Google Photos recognizes and sorts humans based on their faces. Image recognition also includes character recognition for handwriting detection.
- Medical Diagnostics – Machine learning algorithms also have their applications in detecting various diseases by analyzing clinical parameters for research purposes and helping in better tracking of patient health.
Apart from these, self-driving cars, live traffic updates, fraud detection, Google Translate, and dynamic flight pricing are some other applications of machine learning.
10. Which one is better, a decision tree or a random forest? Why?
Answer: Often, random forests are a better version of individual decision trees. Random forests are a collection of many decision trees. As more and more trees are added, the accuracy and stability of the model increase. Here are a few reasons why we think random forests are better:
- A random forest is fully grown because of the presence of multiple trees. Thus, the feature space has multiple smaller regions.
- The boundary from multiple trees is smooth and has a high resolution compared to that of a single tree.
- Random forests consist of random samples from individual decision trees. Hence, it solves the problem of overfitting that can happen with individual decision trees.
11. Do you know about the kernel trick? How is it useful?
Answer: A kernel is a method of computing the dot product of two vectors in a high-dimensional space. We use the formula D = A . B to calculate the dot product of two vectors.
The kernel trick is used before applying the SVM algorithm to improve its accuracy and performance. If a data set has n features, the SVM separates them using (n-1) dimension hyperplane. The data sets are not linearly separable. Hence, SVM fails to perform well on non-linear data (imagine the number of transformations when n is a big number).
With the kernel trick, we can use a linear classifier to classify data with non-linear parameters without explicitly transforming the vectors into a higher dimension. That means the computation is still done in the lower dimension, but we can separate the data that we weren’t able to do before using the kernel method, which separates the data in a higher-dimensional space.
12. How are machine learning and artificial intelligence related?
Answer: Machine learning is a subset of artificial intelligence, where machines can perform certain tasks and learn and improvise through experience and data. In other words, machine learning comes under the umbrella of AI and focuses on writing computer algorithms that solve different types of problems like classification and regression.
13. Explain some ways to handle corrupt or missing data.
Answer: There are several ways to do this. Some of the best ways are:
- Predicting the missing/corrupt values using different machine learning algorithms. For example, we can use linear regression to predict a null value for a numerical column.
- For null values in the dataset, algorithms like KNN and random forest provide good support in filling missing values.
- We can create a new category, like ‘unknown,’ to cater to missing or corrupt data. This way, we don’t have to eliminate any data.
- Deleting rows that have corrupt or missing values.
- Replacing the value with median, mean, standard deviation, or mode.
14. What are the most common types of bias in machine learning?
Answer: Following are the most common forms of bias in machine learning:
- Confirmation bias – It happens when the person analyzing the data has some assumptions about the data. To prove the same, they exclude certain variables from the analysis itself.
- Selection bias – This happens when the sample doesn’t represent the entire population of data.
- Outliers – Data points that are predominantly different from other values. For example, a value with an age of 35 years in the dataset contains data about people from age 50-80.
- Overfitting and underfitting – When a model fits too closely with the data points and includes even noise, thus, reducing the performance of the model. Underfitting is just the opposite, where an overly simplistic model is generated that is unable to capture the correct relationship between the features and the variable.
- Confounding variables – Variables that influence the independent and dependent variables. For example, exercising is directly proportional to weight loss. You might, however, miss that diet control may have a significant impact on weight loss too. Thus, diet control is a confounding variable.
15. What are the differences between machine learning and data science?
Answer: The main difference is that machine learning is a branch of AI, whereas data science uses machine learning algorithms to perform predictive analysis, find trends, and forecast the future.
16. What is collaborative filtering, and where is it used?
Answer: The most common application of collaborative filtering is recommender systems (Amazon and Netflix). Collaborative filtering is an approach to finding user preferences by learning from previous user experiences.
For example, browsing history and genres of movies watched. By knowing this information, machines can recommend relevant items to the user, thereby increasing sales as well as user satisfaction.
There are two collaborative filtering approaches:
- User-based – Finds similar patterns between users who found a particular item interesting. For example, if user A likes comedy movies, and user B also likes a particular comedy movie, will user A also like that movie?
- Item-based – Finds similarities between two items to find if a user who likes item A will like item B or not.
17. Explain the Naïve Bayes classifier.
Answer: Naïve Bayes classifier is a supervised learning algorithm based on the Naïve Bayes algorithm. The algorithm calculates the probability of occurrence of event A if another event B has already happened. A is called the hypothesis, and B is called the evidence.
We can write the formula to calculate the likelihood of A when B has occurred as:
P(A/B) = P(B/A)*P(A)/P(B)
Here, P(A/B) is the probability of occurrence of A when B has occurred, P(A) is the probability of occurrence of event A, P(B) is the probability of occurrence of event B, and P(B/A) is the probability of occurrence of B when A has occurred.
Now, if we have a vector v having multiple features, Naïve Bayes can calculate the probability that the vector belongs to each of the classes C which has k possible outcomes.
P(Ck/v) = P(v/Ck)*P(Ck)/P(v) P(v/Ck)
is the joint probability P(Ck, v1, v2, ….. vn), which is: P(v1|v2…vn, Ck)*P(v2|v3…vn, Ck)*…..P(vn|Ck)*P(Ck)
Naïve Bayes assumes that these conditional probabilities are independent of each other. That is, the occurrence of feature v1 is independent of feature v2 and so on.
Using the probability model, we can construct a classifier. Naïve Bayes classifier has various applications including, face recognition, sentiment analysis, spam detection, weather prediction, and more.
18. Explain the terms likelihood, marginal likelihood, and prior probability with respect to the Bayes algorithm.
Answer: To answer this, let's understand the Bayes Theorem, which is a slight modification of the Naïve Bayes theorem that we have seen in previous questions. It finds the likelihood of an event happening based on the prior knowledge of the conditions related to the event (in the below equation P(A/B) or posterior probability).
For example, if a person is overweight and has high sugar levels, the likelihood of them having diabetes is high. P(A/B) = P(B/A)*P(A) ------------------- P(B) In this theorem,
- Likelihood – It is the probability of event B to be true if A is already true, i.e., P(B/A).
- Marginal likelihood – It is the probability of B is true, i.e., P(B).
- Prior probability – The probability or knowledge that A is true, i.e., P(A).
19. What is a time series dataset? What is the best algorithm to analyze such a data set?
Answer: In a time-series dataset, the data is in a series of particular time spans or intervals. SVM and KNN are the best algorithms for analyzing time-series datasets.
20. In what scenarios should you use a logistic regression algorithm?
Answer: Logistic regression works well for binary or dichotomous variables (let’s say Y). A dichotomous variable can have only two possible values, like yes or no, 1 or 0, and true or false. There can be many variables X that are related to the Y-variable, and the outcome of Y (yes or no) depends on the combination of these explanatory X variables.
Intermediate-Level Machine Learning Interview Questions
21. What is PCA? How does component rotation affect PCA?
Answer: PCA or Principal Component Analysis is a technique in statistics that transforms the data into new coordinates to differentiate and summarize the data points where there are many correlated variables. For example:
| 1st Sample | 2nd Sample | 3rd Sample | 4th Sample | |
| Variable 1 | 1 | 1.1 | 5 | 6 |
| Variable 2 | 2 | 3 | 7 | 9 |
| Variable 3 | 1.2 | 3.4 | 8.6 | 9.8 |
For these variables, we can plot a graph with X, Y, and Z axes for variables 1, 2, and 3, respectively. However, if there are more than three variables, it would not be possible to plot a graph.
Therefore, we can reduce the dimensions of the datasets through PCA so that they can be clustered. PCA draws a line through the origin and then finds out the difference between a point in the line and the actual data point. Then it optimizes the line to minimize the distance by finding the squared distance between the points.
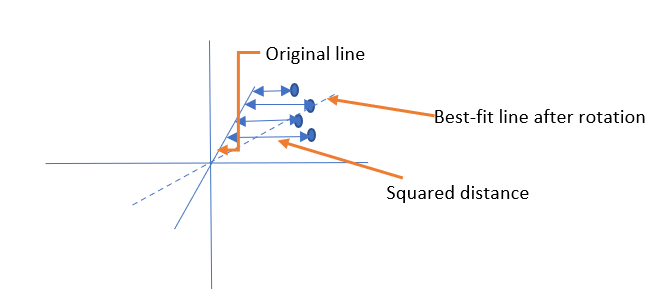 Component rotation is the orthogonal rotation used for factor analysis in PCA. Through rotation, we can get clusters of correlated variables. Rotation brings the data points at a distance relative to the origin. However, it doesn’t change the relative location of the points from each other. This makes it easier to calculate variance.
22. How can you achieve maximum variance in PCA?
Answer: To get the maximum variance, we select the dimension that increases the distance between most data points. Then we project the points onto a vector v and calculate the variance of the projections.
23. What is gradient descent? Explain its use with an example.
Answer: To understand gradient descent, we should know what a gradient is. The gradient is a measure of the change in the output function based on small changes in the input. The gradient is generally the slope of a function when represented in a graphical form. If the slope is steep, the learning in a model is faster, and if the slope is zero, there is no learning.
Gradient descent is a minimization algorithm that minimizes a given function. The minimization is determined through the learning rate, which is the rate at which we move in the direction of the local minimum. Gradient descent is mainly used to minimize cost function iteratively.
Here is a nice KDNuggets article that gives a practical example to explain Gradient descent.
24. What is a correlation matrix? How is it useful?
Answer: It is a matrix (or table) that shows correlation coefficients between variables. Every cell in the table shows a correlation between two variables. Both rows and columns have the same variables, and the row and column having the same variable always have a value of 1, indicating they are perfectly correlated. A higher value means a higher correlation. Here is a simple example:
| People who like chocolates | People who like ice creams | |
| Chocolate-liking people | 1 | |
| Ice-cream-liking people | 0.87 | 1 |
As the number of variables increases, the correlation value changes. The final value is the average of all the values of a row in the matrix. The primary purpose of the correlation matrix is to find patterns in large datasets. In addition, we can also use it for exploratory data analysis and as a diagnostic measure to perform deeper analysis.
25. What is the gradient boosting algorithm? How is it different from a random forest?
Answer: The gradient boosting algorithm is an algorithm useful in classification and regression problems. It produces a prediction model that is an ensemble of various weaker prediction models. For example, a decision tree.
GBM can reduce bias and variance but can overfit. It is a type of sequential classifier. Both GBM and Random forest are examples of an ensemble, which is just a collection of predictions to give the final prediction. Some notable differences between GBM and Random forest are:
| GBM | Random forest |
| Multiple random samples are produced. However, the final prediction is the weighted average of all the predictions. | It uses a bootstrapping method, i.e., generating random samples from the dataset and predicting the final one as a simple average of all the samples. |
| We can use SVM, decision tree, or any algorithm that works best for us. | It uses only decision trees for prediction. |
| It is a boosting type of ensemble. | Random forest has a bagging type ensemble. |
| GBM consists of sequential classifiers, i.e., build one tree at a time, and the next tree depends on the correctness of the previous tree (weak learner). | Each classifier is independent of other classifiers. |
| It reduces variance and bias. | It can reduce variance only. |
| A model can overfit. | Random forest handles overfitting quite well. |
26. Explain SVM.
Answer: SVM or Support Vector Machine is a supervised learning algorithm. It is a non-probabilistic, linear, and binary classifier. SVM can also perform non-linear classification using the kernel trick, where inputs can be mapped to a hyperplane (higher dimensional plane). SVM finds the best margin between the support vectors and the straight line, circle, or any solid plane that separates the features (vectors).
27. State some differences between k-means clustering and KNN algorithms.
Answer: Since the names are similar, many people often confuse the two. Here are some important differences between k-means clustering and KNN algorithms:
| k-means clustering | KNN |
| It is an unsupervised algorithm used for clustering with no labeled data. | It is a supervised learning algorithm used for classification, where we give labeled data as input for training. |
| k refers to the number of centroids, or cluster centers picked randomly. | Here, k refers to the closest neighbors of the target label. |
| The algorithm is complete when the clusters stop moving from one to another. | A KNN algorithm is said to be complete when all the classification is completed with the highest accuracy. |
| We can optimize the algorithm using the elbow method and silhouette method. | Optimization can be done using cross-validation and confusion matrix. |
28. What are type I and type II errors?
Answer: We make many decisions based on probabilities. Thus, there are chances of making mistakes and coming to incorrect conclusions. There are four possible outcomes of any decision using statistics, of which two are correct, and the other two are wrong (errors).
The two errors, Type I and Type II, are related, and increasing one decreases the other and vice-versa.
- Type I error occurs when a true null hypothesis is rejected. It is also called a false positive. It means that you assert that something is true when it is false in reality.
For example, you think that you will win a game of monopoly by strategically tossing the dice and buying certain specific properties. And, when you do that, you win the game a greater number of times. However, if that’s not true, and your winning with those conditions is just by chance, then that’s a type I error.
- Type II error occurs when a false null hypothesis is accepted. It is also called a false negative.
For example, you believe what a friend says about someone else without knowing the other person’s side of the story. You have all the information that makes you think whatever your friend said is true, which it is not because you did not cross-check it to be correct with the actual person.
29. What is stratified sampling? How is it better than random sampling?
Answer: Stratified sampling is a sampling method where the population is divided into smaller groups based on characteristics (like age, marks, gender, and income group), also called strata, and a probability sample is drawn from each group.
Compared to random sampling, stratified sampling gives more precision for the same sample size. We can also reduce the sample size depending on the precision we want to achieve.
Random Sampling
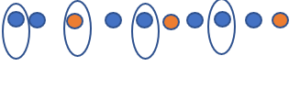
Stratified Sampling

30. What type of analytics can be done with machine learning algorithms?
Answer: Predictive analytics is done using machine learning algorithms. It is used in many industries for automation, marketing, detection of diseases, prevention and detection of fraud, and forecasting. Usually, supervised machine learning techniques are used for prediction.
31. Mention some of the Python (or R) libraries you have used for machine learning algorithms.
Answer: Python libraries:
- Numpy
- pandas
- scikit-learn
- matplotlib
- scipy
- PyTorch
- TensorFlow
R libraries:
- ggplot2
- CARET (Classification and Regression training)
- random forest
- part
- wordcloud
32. What is the difference between training and testing sets? How do you split the data into training and testing sets?
Answer: The training set is used to learn from the data and build a model. Test data is used to validate and test the accuracy of the model when new data is supplied to it. We can split the data into training and testing sets using partition by supplying the percentage. Usually, the data is split as 80-20. However, no rule says so. In Python, you can use train_test_split to split the data.
33. What is a confusion matrix? Give an example to explain.
Answer: The confusion matrix helps visualize the accuracy of a classification model by comparing the predicted and actual classes. For example:
| PREDICTED | ||
| FALSE | TRUE | |
| FALSE | TRUE NEGATIVE (TN) | FALSE POSITIVE (FP) |
| TRUE | FALSE NEGATIVE (FN) | TRUE POSITIVE (TP) |
| RECALL | ||
- TP/(TP + FP) indicates the precision.
- TP is true positive, i.e., the predicted value is rightly predicted as true.
- FP is false positive. Here negative or false value is incorrectly predicted as true.
- FN is false negative. These are positive values incorrectly predicted as negative values.
- TN is true negative. It is a negative value rightly predicted as an actual negative.
We can calculate the accuracy using the following formula:
Accuracy = TP + TN -------------------- TP + TN + FP + FN
For example, a classifier algorithm determines the age range of a person based on their facial features. We feed the data along with labels and ask the algorithm to predict the values. Once all the values are predicted, we can apply the accuracy test to evaluate the correct values.
34. What type of learning algorithm is playing a game of chess with the machine ?
Answer: A game of chess with a computer is a type of reinforcement learning. Rather than feeding all the moves into the computer, it is made to learn the game and think like how a human would think. The computer improves as more and more scenarios and moves are put forward. It is implemented using neural networks.
The system takes a decision and makes a move, checks if it is the right move through feedback, and learns the next set of moves. The feedback can be positive or negative, based on which the computer is either punished or rewarded.
35. What are the differences between classification and regression algorithms? How do you decide which one to use?
Answer: Both classification and regression are supervised learning algorithms. However, classification divides the data into categories (class labels) and not a single value. For example, a set of balls can be categorized (or sorted) based on their colors. Regression algorithms predict a certain value or numerical quantity. For example, the age of a person is based on their characteristics, likes, lifestyle choices, and so on.
Classification problems are evaluated using accuracy, whereas regression problems are evaluated using root mean square error. Some algorithms like decision trees can be used for classification as well as regression problems. If the problem is to label the data and assign it to a group, then we can use classification algorithms. However, if it is to find a quantity or a continuous value, we should use regression algorithms.
36. What is the decision tree? What are the types of decision tree algorithms?
Answer: A decision tree is a supervised learning algorithm used for both regression and classification. It is called a tree because, based on the features, certain questions can be formed, the answers to which are obtained by splitting the data into further questions or categories until there are no more categories left to split. Read more about the decision tree for machine learning .
37. Which type of algorithm is email spam detection? How does it work?
Answer: Email spam detection uses the decision tree algorithm. Decision trees are based on splitting the data based on some questions. The questions are related to the attributes of the dataset. Here is our detailed article on how decision trees in machine learning work .
38. There are many machine learning algorithms. How will you choose which one to use for which problem?
Answer: Many times, choosing the right algorithm could be just a trial and error way. You can try different algorithms and compare the accuracy to cross-validate them. If your dataset is huge, you should go for algorithms with high variance and low bias, whereas if your dataset is small, you should try algorithms or models that have low variance and high bias.
39. What is a recall?
Answer: A recall is the total number of truly positive results out of the results identified as true in a classification problem. For example, if the algorithm identifies 7 fruits as apples out of a set of 15 fruits, and only 4 are apples, then the recall will be 4/15.
40. Enlist various steps of machine learning.
Answer: Although machine learning mainly involves building, training, and testing a model, it includes several other preparation steps to reach this final stage of model creation. The various steps of machine learning are:
- Data collection – Just having a large dataset is not enough. The accuracy of a model depends upon the quality of data.
- Data preparation – Wrangle and prepare data for training purposes. You may have to clean the data, remove duplicates, correct missing or corrupt values, normalize data, change data types, and so on. Perform exploratory analysis on the data and split it into training and testing sets, e.g., 80:20 or 70:30.
- Model selection – Choose the appropriate model (algorithm) to solve the given problem.
- Train the model – The model should be trained such that the accuracy score is high so that we can get an accurate prediction. To achieve this, many iterations are performed so that the model can improvise and improve.
- Test the model – Using testing data (new data), test the accuracy of the model.
- Tune the model – Tune the model parameters to increase the performance and correct overfitting and underfitting.
- Prediction – Make predictions based on the outcome of the model.
41. What is data mining?
Answer: Data mining is the process of finding patterns and trends in large datasets using statistics, machine learning, and other aspects of data science. We also refer to it as Knowledge Discovery in Data (KDD). Some of the most popular data mining techniques are classification, regression, clustering, prediction, and so on. R, Python, and Oracle are some of the most popular tools used for data mining .
Advanced-Level Machine Learning Interview Questions
42. What is the meaning of K in the KNN algorithm?
Answer: KNN algorithm is the k-nearest neighbor algorithm. In this, ‘k’ refers to the closest neighbor of the target label.
43. Explain how the KNN algorithm works.
Answer:
KNN uses feature similarity to classify new data. KNN doesn’t make any assumptions about the data and leverages all the data for training. Suppose we have a new label, as shown in the following figure, as the red triangle. This is the point we need to classify either as purple squares or yellow circles.
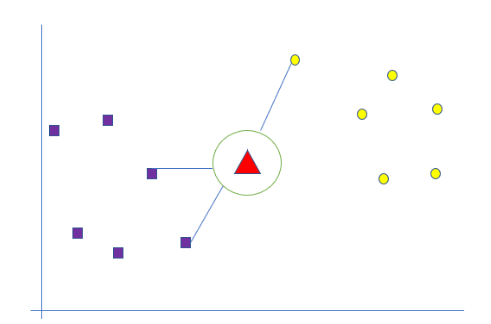
The algorithm finds the ‘k’ nearest neighbors and then calculates the distance between the samples and the query instance (red triangle). Determine the nearest neighbors based on kth minimum distance. Based on the above, there are more purple neighbors of the red triangle than the yellow ones. Hence, the triangle will be classified as a purple square.
44. Explain unsupervised learning algorithms.
Answer: Unsupervised learning algorithms are ML algorithms where there is no labeled data, and the machine figures out patterns by self-learning. These algorithms are capable of performing more complex analyses compared to supervised methods. The main idea of unsupervised learning is to cluster the data into similar groups.
45. What is the difference between inductive and deductive machine learning?
Answer: Inductive learning is learning that’s given by someone to us. For example, if a child is about to touch fire, we tell them not to do so as it is dangerous, and they should not experience it even once. In this type of learning, we draw conclusions based on a set of pre-defined principles and not by experience. In deductive learning, learning happens through experience.
Well, what if we don’t tell the child not to touch the fire. We let him play so that he realizes not to repeat the same thing. We can use both inductive and deductive learning to train Machine learning models.
46. What is ensemble learning? Explain boosting and bagging.
Answer: Ensemble learning is a process where we combine multiple models to give the outcome. For example, a random forest is an ensemble learning algorithm that ensembles various decision trees to generate the final prediction. Ensemble methods are of two types:
- Bagging – Bagging is used when we want to decrease the variance while bias remains the same. In bagging, the dataset is split into subsets, and different models can be run on each individual set. The prediction generated from all the sets is then averaged to get the final prediction. Bagging helps with overfitted models. However, it doesn’t help much with models having a high bias. Random forest is an example of a bagging type ensemble.
- Boosting – This is a sequential ensemble type where data is split into subsets that are trained one after the other. Once you train one subset, you weigh the samples that are wrongly classified in the last (previous) phase with a higher weight than others. In a way, you are making the model learn from its previous mistake, thus reducing the variance while also correcting the high bias. GBM (Gradient Boosting) is a good example of boosting ensemble type.
47. What is dimension reduction? How is it done?
Answer: Every day, huge volumes of data are collected from various sources like social media, shopping websites, and mobile apps. Collecting this data to make sense out of it and bringing a solid inference is a challenge, especially when there are a lot of features (variables).
With dimensionality reduction, we can reduce the number of variables by creating a subset that can capture information as much as the original set of variables would do. Using dimensionality reduction, we can save a lot of storage space, and the number of features (dimensions) will reduce. It will also be easier to train the model when there are fewer dimensions.
Some techniques for dimensionality reduction are:
- Missing value ratio – If one or more variables have too many missing values, we can drop the variable and thus reduce the size.
- Low variance filter – If there is no variance in the value of a variable, i.e., the variable values remain the same through most or all of the dataset, it won’t be useful, so it can be removed.
- High correlation filter – Variables having high correlation are likely to carry the same kind of information. Thus, we need not retain both variables.
- Random forest – We can select a small subset of features to determine which features are most helpful for training the model.
- Factor analysis – In this method, variables are grouped by their correlations, where the variables of the same group have a high correlation with each other, but a low correlation with the variables of other groups. Each group is called a factor.
- Principal component analysis – In this algorithm, a set of variables is converted to a new set of variables extracted from the original ones. The new variables are called Principal Components. Each principal component is a linear combination of original variables.
48. Which is your preferred language for machine learning? Why?
Answer: This question depends on your personal experience. For example, if you have worked with R, you can say it has a lot of ready-to-use and advanced libraries to perform complex calculations and is a robust language. With R Studio, you can visualize data in a better manner.
On the other hand, if you have extensive experience in Python, you can state some of the advantages of using Python. The Python programming language has many libraries explicitly for machine learning, and it is easy to code and understand.
49. Have you worked with any unsupervised learning algorithm? Explain any one.
Answer: This question is based on your personal experience. The interviewer may also ask variations of the same question like explaining any unsupervised learning algorithm or what are unsupervised learning algorithms.
50. What is the standardization of data?
Answer: Standardization is a method used for rescaling data attributes. It is done to find the mean and standard deviation of attributes where the mean would be 0 and the standard deviation would be 1. In Python, standardization can be done using sci-kit-learn’s StandardScalar as, scaler = StandardScaler().fit(input) rescaledVal = scaler.transform(input)
51. Mention some of the tools used for machine learning.
Answer: Scikit-learn, Rapidminer, TensorFlow, PyTorch, and Knime.
52. What is an analysis of covariance (ANCOVA)?
Answer: ANCOVA is an extension of ANOVA that includes a covariate, i.e., inclusion of a continuous variable along with dependent and independent variables.
53. If you have a small training set, which ML algorithm will you use? What if your training set is big?
Answer: Logistic regression and Bayes classifier algorithms are ideal for small training sets. Algorithms like linear regression and k-means clustering are some methods for larger training sets.
54. Suppose you write an algorithm to detect if a person has a particular disease. What should be the minimum accuracy of the model, and how to improve it?
Answer: To detect if a person has a particular disease or not, we use classification algorithms. The algorithm should have an accuracy of at least 99% to cover most cases. To evaluate the performance of the model, we should use True Positive Rate (Sensitivity or TPR), True Negative Rate (TNR or Specificity). The data should be balanced, and the algorithm should self-improve by giving higher weight to the wrong predictions in each iteration.
55. Suppose you are the sales head of your company. There hasn’t been much increase in the sales of your product in the last quarter, and you want to know why. How can ML help in achieving this?
Answer:
- Using data science and machine learning algorithms, we can analyze the data regarding the sales data and help identify the target audience so that sales reps can focus on marketing to those people.
- Machine learning algorithms can also generate a profile of how a sales rep should be, key roles, and responsibilities so that they can deliver their best.
- Machine learning algorithms are known for accurate predictive analysis of the data. The algorithms can quickly find patterns and trends and identify the points where the sales are deviating from their ideal status.
- Through machine learning, we can enhance the accuracy of risk models thus, mitigating risks and other unforeseen obstacles.
56. Which one is more important – false positive or false negative?
Answer: One can’t say which is more important. Both false positives and false negatives have their impact. A false positive can lead to unnecessary treatment, which is dangerous because it can cause side effects other than wastage of time and money.
On the other hand, false negatives can lead to incorrect diagnostics, thus completely ignoring the real issue that a patient has.
Both errors can be minimized by collecting more information through other variables, increasing the TPR and TNR (aka sensitivity and specificity) of the test, or taking the test multiple times. However, when one type of error reduces, the other increases. In such cases, scientists evaluate which type of error is less dangerous and make appropriate decisions.
57. What is the R squared method? What is it used for?
Answer: R square is a statistical measure that explains the extent of variance in one variable (dependent) as compared to other independent variables. To calculate R2, we use the best fit line from a regression model and subtract the predicted values from actual values and square the results. This would be the list of error2, which then summed gives the unexplained variance.
We can calculate the total variance by subtracting the average actual value from each actual value and squaring and summing the results. Later, we can calculate R2 as:
R2 = 1 – (unexplained variance/total variance)
It is used for finding the best fitting line with the least error. A value of 100% indicates that the model explains all the variability in the response data around the mean. A higher value of R2 indicates a better fitting for the model.
58. What are the advantages and disadvantages of a linear model?
Answer: Advantages of a linear model:
- It is the simplest model to execute.
- It is easy to visualize.
- When we know the relationship between the independent and dependent variables, the algorithm is the most suitable.
Disadvantages of a linear model:
- Most of the time, there is no clear relationship between the dependent and independent variables.
- Linear regression cannot handle outliers.
- It is ideal to use only when there is a linear relationship between the variables.
59. What is the difference between RMSE and F1 scores?
Answer: The F1 score is a metric defined as the combination of recall and precision metrics. It can range from 0 to 1, where 1 is best, and 0 is worst.
F1 = 2 * (recall*precision/(recall + precision))
F1 is more useful than accuracy when the class distribution is uneven. RMSE is the measure of the standard deviation of the errors (residuals). It tells how spread the residuals are.
RMSE is calculated as the square root of the Mean Square Error or MSE. It calculates the average sum of the squared difference between predicted and actual values for all the data points. MSE = 1/n(?et2), where the sum ? is for i = 1 to n. et is the difference between the actual and predicted values. RMSE = ?MSE
60. What is an intelligent cloud?
Answer: The integration of the cloud with machine learning is termed intelligent cloud. Having ML algorithms and data storage on the cloud can greatly speed up the computation time. Most top cloud leaders offer ML capabilities. Some examples of ML using the cloud are cognitive cloud, chatbots, personal assistants, IoT, and business intelligence.
Conclusion
The interviewer might ask you to write down formulae, draw diagrams, and explain concepts like linear regression, SVM, decision trees, and others using pictures. They might ask you one or two questions about real-life problems that you can solve using machine learning, such as:
- Recommendation systems.
- Email spam filtering.
- How to remove outliers from data?
- Give a practical case for using a decision tree.
- Selecting the right algorithm for the given problem with a given dataset.
For example, which algorithm will be ideal to determine if a person has cancer or not, or which is the best algorithm to understand the shopping preferences of people aged between 15 and 20 years, or which algorithm is the best one to understand if a particular person will opt for a particular course or not.
Think about each question from an analytical angle. Whether your choice of algorithm is right or wrong, your justification should be logical and thorough. The important thing that the interviewer wants in you is whether you are able to think logically, give appropriate reasoning for your actions, and be able to solve problems mathematically by analyzing huge datasets or not.
People are also reading:
- Machine Learning Books
- Best Machine Learning Frameworks
- How to become a Machine Learning Engineer?
- Machine Learning Projects
- Classification in Machine Learning
- AI vs. ML vs. Deep Learning
- Machine Learning Applications
- Machine Learning Algorithm
- Data Science vs. Machine Learning
- Decision Tree in Machine Learning