
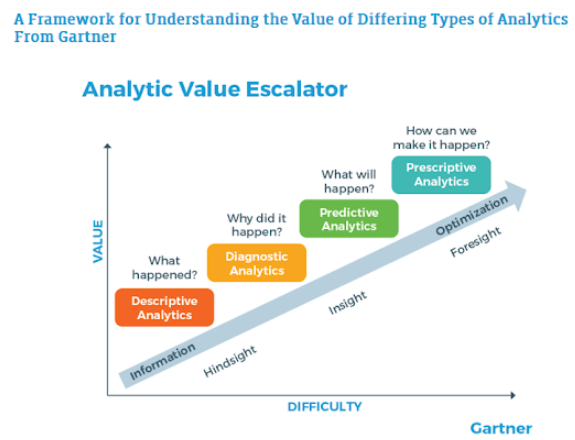
There are four types of analytics in data science, namely descriptive, diagnostic, predictive, and prescriptive. While descriptive and diagnostic analytics focus on root cause analysis, predictive analytics takes it one step ahead. It helps companies make predictions for the future so that a business can be steered in the right direction before it’s too late. It answers the question, " what will happen?"
The below chart from Gartner will help you visualize the above:
Since it is ‘Predictive’ in nature, predictive modeling is more about
probability
(or likelihood) than
certainty
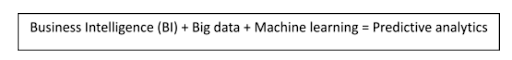
. So how does it happen? We get big data from multiple sources. When
business intelligence
(BI) is applied to big data using advanced tools and techniques, we get powerful patterns and business predictions for the future.
 There are plenty of use cases for predictive modeling as of today, spread across various domains like banking, insurance, telecom, finance, and healthcare. We will discuss the following essential aspects of predictive analytics:
- Business knowledge (business intelligence)
- Data mining
- Machine learning
- Visualization
Why is Predictive Analysis Important?
Do you check your daily horoscope to know what your day is going to be like? We are all always curious to know what’s going to happen next, whether it is with our life or events that affect our life.
Wouldn’t it be nice to know what career options are best for you? What if you can decide on the best living place based on facts, history, and many other factors? You will be able to do more productive things if life is a bit more certain and you know a few things beforehand that are otherwise unpredictable.
Predictive analytics helps you make better decisions by making predictions about unknown future events. It is a part of data mining and uses tools and techniques from statistics, modeling, and machine learning. For companies, predictive analytics helps minimize risks, optimize operations and performance, and maximize company profits.
Data Mining and Predictive Analytics
We hear about big data everywhere, and rightly so because it's growing exponentially. With the recent COVID-19 developments, more people are moving towards digitization, making data collection and processing much more effective. What you need from this big data is the real question.
What is it in the data that you can effectively use for the company and the customer’s benefit? Data mining uses statistical methods and machine learning techniques to obtain these hidden patterns. We can refine the data resource using business intelligence and get new insights from the discovered patterns and trends through predictive analytics. So:
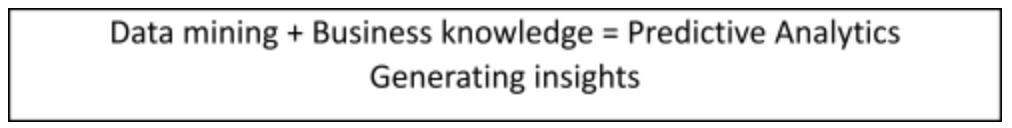
Companies use these insights to understand customer behavior, fraud or suspicious transactions, marketing trends, business enhancements, improving customer base and overall operations, marketing campaigns, and so on. Some standard predictive modeling techniques are linear regression, logistic regression, SVM, neural networks, K-nearest neighbors, decision trees, and gradient boost.
How to Implement Predictive Analytics?
There are two significant approaches to implementing predictive analytics. Both are completely different and have their own set of pros and cons. You can use either of them depending on the business requirements. However, the two approaches can also complement each other in some scenarios! These are the two approaches to predictive analytics:
1. Data-driven Analytics
We get so much data from various sources. It is essential to make use of these data chunks to gain useful business insights. This requires good analytical and design techniques. Some popular tools used for data-driven analytics are Excel, Tableau, and BigML. This type of predictive analytics is much more suitable for large-scale data that doesn't necessitate prior business knowledge.
2. User-driven Analytics
User-driven analytics is specific and requires good domain knowledge to meet specific customer requirements. It is suitable for a particular target audience having a limited dataset size. The results are easy to adopt and apply because of the specificity.
Three Pillars of Predictive Analytics
We have seen that business knowledge when combined with data mining tools and techniques, leads to effective predictive analytics. Predictive analytics involves three primary tools. These are data mining, statistics, and machine learning. The following table gives out some important details about the trio:
| Data Mining | Exploring Big Data | |
| Handling Various Data Types | ||
| Visualization | ||
| Statistics | Converting Raw Data into Matrix | |
| Creating Data Groups | ||
| Finding Associations in Data Items | ||
| Machine Learning | Clustering Data | |
| Classifying Data | ||
| Applying Models |
|
|
| Making Predictions | ||
1. Data mining
Data mining is finding hidden trends and patterns in the data by applying different techniques and tools. It is like digging for data to discover all the possible knowledge from data. Data mining involves gathering data from multiple sources, integrating it, transforming the data into a better form, and using a combination of visual and statistical techniques to find trends and patterns in the data.
- Exploring big data: Data is obtained from various sources like data warehouses, cloud systems, databases, CSV files, and so on. This data must be first integrated into a single source for further cleaning and processing. The data might have null values, missing values, redundant data, duplicates, and other issues.
- Handling various data types: The data we get from multiple sources can be unstructured or structured. Usually, it is a mix of both. It can also be static or streaming data, for which there are many frameworks like Spark to handle. Same way, behavioral data, demographic data, and other categories of data have to be handled individually and put into categories. Once data is classified, it is easier to apply techniques to explore more.
- Visualization: Viewing data in the form of charts and graphs using tools like Excel and Tableau is easier and faster because these offer many perspectives into the same dataset. A visual representation also makes it easy to explain data insights to business analysts and other non-technical persons involved in the project.
2. Statistics
Statistics plays a vital role in pre-processing and processing data before applying modeling techniques. You need to be good with the formulae. For example, mean, median, standard deviation, and correlation. The statistical model helps in making more accurate assumptions and inferences about a dataset.
- Converting raw data into a matrix: Representing data in a matrix format or tabular format makes it easier to apply statistics and process data. This is where languages like Python and R outshine other options. They use data frames to transform data into a tabular format, making it more organized and easier to process.
- Creating groups of data: Classifying or grouping similar data reduces the redundancy and size of the dataset. Some popular grouping techniques are aggregation, median, mode, and removing null/empty/duplicate values.
- Finding associations in data items: Finding associations or correlations between different variables in the dataset leads to the compression of data and combining similar columns into one. Suppose we know that the salary of a person increases with their years of experience. Thus, we can plot a linear graph and conclude that the variables, salary, and experience, are directly proportional. In this case, we can merge these two variables into one. Associations can also lead to a better understanding of customer behavior, and thus, it helps to change the business strategy accordingly.
3. Machine learning
Once we can process the data and get our final ‘analyzed’ dataset, we should apply some modeling techniques to gain insights, patterns, and predictions. There are many algorithms to choose from. Sometimes, it may take time to determine the right model, and you may end up applying more than one algorithm.
- Clustering data: Clustering techniques allow us to group similar kinds of data. These techniques find a use for customer segmentation, image processing, pattern recognition, and so on. There are different clustering algorithms like k-means clustering, hierarchical clustering, density-based models like DBSCAN, and so forth.
- Classifying data: Classification also involves grouping data based on known class labels. It is the supervised type of machine learning. Some popular classification techniques are K-nearest neighbors, support vector machines (SVM), decision trees, and neural networks.
- Applying models: A model can be created using the data available. Usually, the data is split into training and testing datasets to apply the model to an unknown set of data and see how it performs. Once the model is created, it has to be deployed and evaluated for accuracy and performance. Some metrics used for performance evaluation are confusion matrix, precision, sensitivity, ROC (Receiver Operating Characteristics) curve, and F1 score.
- Making predictions: Once the model is tuned and evaluated, it should make predictions that are helpful for the business. It should solve the problem for which it was created in the first place. Tools like Weka, RapidMiner , and Power BI are handy for making predictions on datasets.
Steps Involved in Predictive Modeling
We have seen above how predictive modeling is done. To summarize, it can be split into two main steps:
- Build a model on historical data : We know that we have to find a variable Y, dependent on one or more input variables Xn. This can be done using supervised or unsupervised modeling techniques. A huge dataset is split into subsets, and models are built on one or more subsets.
- Generalization : In the first step, we created the model using a subset of data. Now, we apply the model to all the subsets of the dataset. In this case, we don’t know the target variable ‘Y,’ and the model will find it out for us.
Applications of Predictive Modeling
Predictive modeling finds use in a galore of domains, including:
- Customer Relationship Management (CRM)
- Fraud Detection : Finding outliers, protecting against regular offenders, better fraud detection techniques, and so on.
- Healthcare : Understanding if the patient is prone to a particular disease based on his past data, proactive monitoring, suggestions for curing a specific condition if predictions are true, and so forth.
- Telecom and Retail : Predictive analytics can help create better campaigns based on predictions for particular marketing campaigns. For example, customer retention, customer segmentation, and cross-sell and upsell.
- Logistics and inventory management
Conclusion
We have seen how predictive modeling helps companies prioritize their goals and get better insights into their client’s likes and dislikes. Predictive analytics is also making a significant impact on the Internet of Things (IoT), and cloud platforms (such as Google Cloud) are powered with predictive analytics to give a better user experience. The whole social media and marketing revolve around predictive analytics, which has given the following benefits:
- Vision : Viewing the patterns and trends in data through extensive analysis. This can help categorize your customers, understand their wish lists, predict what certain users will do (e.g., purchase) next, and find the most essential and potentially long-term clients. Thus, it helps in increasing customer satisfaction and maximizing company profits.
- Decision : With practical insights based on facts available, it is easier to make business decisions driven by facts and models that give consistent and unbiased results.
- Precision : Using tools for predictive analytics and by automating most of the process of reading and analyzing reports and extracting relevant information, we can get more accuracy due to reduced human error. Also, we can save a lot of time and resources.
If you are confused about how this is different from data analysis, then note that the main difference is that predictive analytics makes some assumptions about the data, along with working on past data. Also, predictive modeling is a data mining technique. Further, data analytics is a more prominent term that leads to predictive analytics.
People are also reading:


Leave a Comment on this Post