

R vs MATLAB are two popular data modeling tool s for processing structured and unstructured data. R is a language and runtime environment for graphics and statistical computing. It has several built-in libraries that provide statistical and graphical techniques, including time-series analysis, classification, linear and nonlinear modeling, and classical statistical tests.
MATLAB stands for MATrix LABoratory. It is a matrix-based language that enables data scientists and engineers to perform mathematical and technical computing. It is an integrated environment for computation, visualization, and programming.
If you are perplexed in choosing between R and MATLAB and want to know the major differences between them, you have landed at the right place.
Comparison Between R vs MATLAB
This article intends to draw a detailed comparison between R and MATLAB. But before we proceed, let us first give you a brief overview of R and MATLAB, along with their features, pros, and cons. So, here it goes.
What is R?
R is a widely-used programming language for statistical computing and graphics. It is a popular language among data miners and statisticians for carrying out data analysis and building statistical software.
Not only R is a programming language but also a free and open-source software environment developed in C, Fortran, and R languages. It comes with a command-line interface (CLI) and is available for Windows, Linux, and macOS operating systems. R is highly extensible and provides an array of statistical and graphical techniques.
Moreover, the best part of R is that it enables us to produce well-designed publication-quality plots, including mathematical symbols and formulae. We can think of R as an integrated suite of tools that facilitate data manipulation, calculation, and graphical display. It consists of the following:
- An effective data handling and storage facility.
- A collection of operators for compilation on arrays in specific metrics.
- Graphical facilities for data analysis and display results either on-screen or hardcopy.
- A wide collection of tools for data analysis .
- A simple yet effective programming language.
For learning and mastering the basics of R, consider purchasing the course here .
History
Two statisticians Ross Ihaka and Robert Gentleman created the R programming language as an open-source implementation of the S language. R is an interpreted language that runs without a compiler and was specifically designed for statistical analysis.
This language is named R after the initials of two creators Ross and Robert. In August 1993, Ross and Robert started publicizing R on the s-news mailing list and the data archive SlatLib. The statistician Martin Mächler, in 1995, convinced the creators of R to release it as open-source and free software under the GNU General Public License. Also, in 1995, the first official version v1.0 of R was released.
Later, in 1997, a repository to store R’s executable files, packages, source code, and documentation was released. It was referred to as Comprehensive R Archive Network (CRAN). Initially, CRAN had 3 mirrors and 12 contributed packages. As of now, 101 mirrors and 18,728 contributed packages.
Features of R

Let us now discuss the statistical and programming features of R:
Statistical Features
- Basic Statistics: Mean, mode, and median are the most common and fundamental statistical terms, and they are referred to as “Measures of Central Tendency”. R makes it easy for us to measure central tendency.
- Static Graphics : R comes with rich facilities that let us create static graphics. It provides support for multiple plot types, including biplots, mosaic plots, graphic maps, and many more.
- Probability Distributions: Since probability distributions play a crucial role in statistics, R can effortlessly handle all types of probability distributions, such as Normal Distribution, Chi-Squared Distribution, Binomial Distribution, etc.
- Data Analysis: R provides a wide range of tools for data analysis.
Programming Features
- R Packages: R comes with a Comprehensive R Archive Network (CRAN), which is a repository containing more than 10,000 packages. In addition to it, R also has a wide range of libraries.
- Distributed Computing: R supports distributed computing through two new packages, namely, ddR and multidplyr, released in November 2015.
Advantages of R
Some remarkable benefits of R are as follows:
- R is an open-source programming language. Therefore, anyone can work with the R language without the need for a license.
- It provides exemplary support for data wrangling through dplyr and readr packages.
- R can be paired with other programming languages, like C, C++, Python, and Java.
- It can also seamlessly integrate with data processing platforms, like Hadoop and other database management systems.
- R supports various machine learning operations, including classification and regression.
- Using R, you can develop artificial neural networks (ANNs).
Disadvantages of R
The following are the downsides of R:
- R is not an ideal option to deal with big data since it requires all the data to be present in one place, i.e., in the memory.
- It lacks security.
- It has a steep learning curve, and beginners in the field of programming may find R difficult to learn.
- R does not support dynamic or 3D graphics.
- It is much slower than MATLAB and Python.
When to Choose R?
R is ideal to choose for solving problems related to statistics. It is specially designed for statistical computing and graphics. Data miners, data analysts, researchers, and statisticians around the world use the R programming language and software to retrieve, clean, analyze, visualize, and present data. It has an array of built-in libraries and tools for cleaning and prepping data, creating visualizations, and training and evaluating machine learning algorithms.
What is MATLAB?
MATLAB or MATrix LABoratory is a multi-paradigm programming language and numeric computing environment. It enables us to perform matrix multiplication, implement algorithms, plot data and functions, create user interfaces, and interface with programs written in other languages.
Though MATLAB is purely intended for numeric computing, it uses an additional toolbox and packages to carry out other operations. It uses the MuPAD symbolic engine to provide access to symbolic computing capabilities. Moreover, it uses a Simulink package that lets us add graphical multi-domain simulation and model-based design for embedded and dynamic systems.
Want to learn and hone your skills in MATLAB programming? You can sign up here for the course.
History
Cleve Moler, a computer programmer and mathematician, invented MATLAB based on his 1960s Ph.D. thesis. He was a math professor at the University of New Mexico, and there he started developing MATLAB for his students. In 1967, he developed linear algebraic programming of MATLAB under the guidance of George Forsythe.
Initially, MATLAB was only a simple matrix calculator with 71 pre-built functions. It had no toolboxes, graphics, or programs. It was first released in February 1979 at the Naval Postgraduate School in California. In the 1980s, Cleve Moler and John N. Little reprogramed MATLAB in C and created the MATLAB programming language, which included features for toolboxes.
MATLAB was first commercially released in 1984 at the Automatic Control Conference in Las Vegas. MathWorks Inc. was formed at that time, which released the MATLAB programming language.
Features of MATLAB
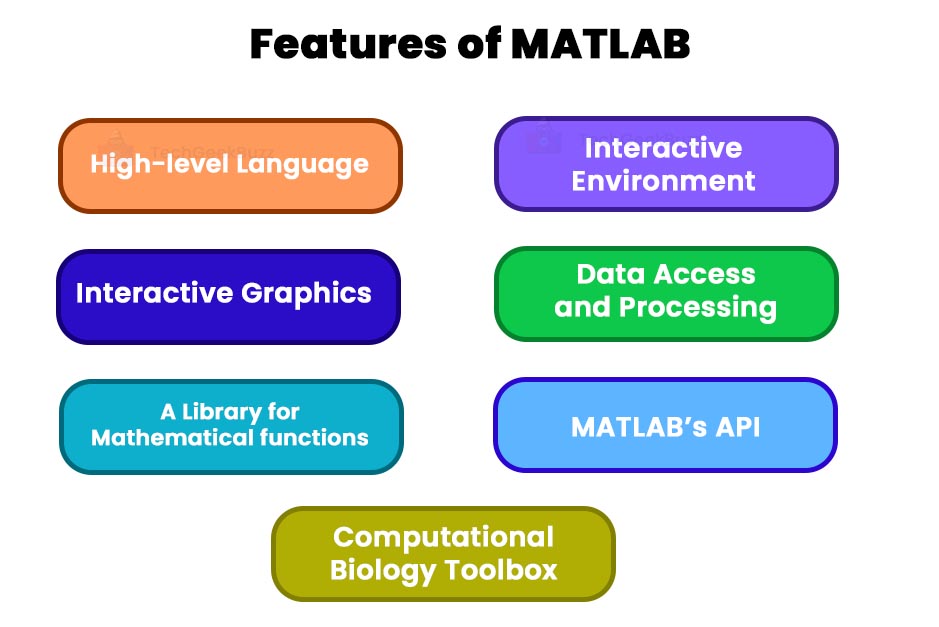
Following are some of the salient features of MATLAB:
- High-level Language: MATLAB is a high-level programming language, and it supports the object-oriented programming paradigm. It also supports control flow statements, such as IF, IF-ELSE, FOR, and WHILE. In addition, it supports the structure, a user-defined data type in functional programming .
- Interactive Graphics: MATLAB’s built-in graphics feature enables us to visualize data present in the form of plots and figures in any of the three dimensions, i.e., 1D, 2D, or 3D. Moreover, it has the ability to process images and display the results in 2D or 3D formats.
- A Library for Mathematical functions: MATLAB has a vast, built-in library of functions that enable a mathematical analysis of any data. This library consists of typical math functions, like sqrt, factorial, etc. Also, it provides functions for statistical analysis, like mean, mode, median, and many others. Functions for signal processing include filler, butter, audio read, fft, fftshift, etc. For image processing functions in MATLAB, include rgb2gray, rgb2hsv, adaptthresh, etc.
- Interactive Environment: MATLAB provides an interactive environment and tools for debugging and deployment of any software. It also provides other tools, like signal analyzers and tuners. The GUI of MATLAB makes exporting and importing easier.
- Data Access and Processing: MATLAB supports the processing of real-time data from JDBC/ODBC and data from external sources, such as image files and audio files. MATLAB has built-in functions for reading data from external sources, like audioread for reading data from an audio file and imread for reading external images.
- MATLAB’s API: MATLAB has an extensive API that enables us to link C and C++ programs directly to MATLAB.
- Computational Biology Toolbox: This toolbox helps researchers and biologists to create and analyze new biological algorithms and patterns. It also helps them to build and analyze biological models.
Advantages of MATLAB
The following are the advantages of MATLAB:
- MATLAB has a user-friendly interface, which is easy to use.
- It has an array of predefined functions that provides prepackaged solutions to many technical problems.
- It supports device-independent plotting, meaning that it enables us to display plots and pictures on any graphical device, provided by a computer on which MATLAB is running.
- MATLAB allows you to implement and test your algorithms effortlessly and quickly.
Disadvantages of MATLAB
Here are some drawbacks of MATLAB:
- MATLAB is slow since it is an interpreted language.
- We cannot create an OUTPUT file in MATLAB.
- Sometimes, the error messages are not adequate or informative, and hence, you have to figure them out by yourself.
When to Choose MATLAB?
Choosing MATLAB would be perfect if you wish to analyze data, develop algorithms, and create models and applications. Scientists and engineers across the globe use MATLAB for deep learning and machine learning, image and video processing, signal processing and communications, computational finance, control systems, tests and measurements, and computational biology.
R vs MATLAB: Head-to-Head Comparison
The following table draws a detailed comparison between R and MATLAB:
| Parameters | R | MATLAB |
| Definition | R is an open-source programming language and a software environment for statistical computing and graphics. It is developed by Ross Ihaka and Robert Gentleman. | MATLAB is a high-performance programming language and numerical computing environment. It is developed by MathWorks Inc. |
| Usage | It is used in the field of analytics to solve analytical and statistical-related problems. | It is employed for various mathematical factors, such as matrix manipulation, signal processing, calculus, and designing graphs. |
| Open-source | R is an open-source language, meaning that anyone can use R and access its source code for free. | MATLAB is not an open-source language and requires you to pay the license cost. |
| Operating system | R is a cross-platform language compatible with macOS, Windows, and Linux systems. | The same licensed version of MATLAB cannot run on different operating systems unless all operating systems are installed on the same physical machine. |
| Ease of Use | Since R follows the syntax of programming language, it becomes challenging for beginners to learn and code. | MATLAB is comparatively easier to learn since it provides an array of built-in functions to carry out specific tasks. |
| Performance | R is slower than MATLAB. However, a skilled professional in R can achieve better and quicker results and boost efficiency. | MATLAB executes all the fundamental programming functions faster than R. |
| Visualization | R provides several graphic implementations, such as Base graphics, Grid graphics, ggplot2, Lattice graphics, etc. | It provides 2D and 3D plotting features. |
| Machine Learning | It provides extensive library sets for machine learning. | MATLAB has a Statistical and Machine Learning Toolbox. |
R vs MATLAB: Which is Better?
After going through a brief overview and features of R and MATLAB, we may conclude that both these languages are closely similar. They both have the same community of users and are ideal for scientific visualization and data analysis. Both, R and MATLAB, are interpreted languages and have different syntaxes.
R is inspired by S and Scheme, whereas MATLAB is inspired by C. R is the best statistical programming language since it provides an array of default and easily accessible statistical methods. On the other hand, MATLAB is the high-performance language ideal for intensive mathematical computations.
Therefore, both R and MATLAB are best in their own ways. The choice between R and MATLAB entirely depends on your project’s functional requirements. More importantly, the choice between the two depends on your experience in programming and the level of knowledge of statistics and mathematics.
Conclusion
R is a popular statistical programming language among educational, government, and healthcare organizations. On the flip side, research institutions, aviation and aerospace industries, and industrial enterprises commonly use MATLAB. Hopefully, this article has helped you gain enough clarity on the differences between R and MATLAB. You can feel free to post your queries or suggestions in the comments section below.
People are also reading:


Leave a Comment on this Post