
Data analytics is a process of extracting meaningful insights from raw and unstructured data. To make the process of data analytics easy and smooth, a myriad of data analytics tools are available in the market, including SAS and R.
Well, SAS and R are among the most popular data analytics tools used by data scientists and data analysts. R is an open-source programming language and software environment, whereas SAS is a software suite for performing various tasks, such as data manipulation, predictive analysis, multi-variance analysis, advanced analytics, and business intelligence .
Both are robust data analytics tools, and hence, it becomes difficult to make a choice between them. If you are also confused between SAS and R, it is important for you to understand what exactly these tools are and how they are different from each other.
Well, this article aims to provide you with all the significant differences between SAS and R. Also, it will walk you through a brief overview of SAS and R, their features, advantages, and disadvantages.
What is R?
R is the most preferred open-source programming language for statistical computing and graphics. Data miners and data scientists use the R language for performing data analysis and developing statistical applications. Moreover, R is not only a programming language but also an open-source software environment. This software environment is available under the GNU General Public License.
The R environment is a comprehensive suite of tools or software facilities for carrying out various tasks, such as data manipulation, calculation, and graphical display. It consists of the following:
- A set of operators for calculation on arrays.
- Graphical facilities to display data analysis results.
- An integrated set of tools for performing data analysis.
- An effective data handling and storage facility.
- A simple programming language called R with input-output facilities and support for conditionals, loops, and user-defined functions.
The R language is the implementation of the S programming language. It is designed around a true computer language, enabling you to define and use your own functions. Moreover, the R distribution comes with around eight packages through which you can extend its functionality.
History
Ross Ihaka and Robert Gentleman created the R language as an open-source implementation of S, along with lexical scoping semantics from Scheme. This programming language got its name partly from the initials of both the creators, Ross and Robert. Also, it was named partly as a play on the name of S. It is an interpreted language, and most of the programs for S run without any modification in R.
In 1991, the creators of R, namely Ross and Robert, at the University of Auckland, New Zealand, started working on developing R. They started publicizing R in August 1993 on the data archive StatLib and the s-news mailing list. Later, in 1995, they released R as an open-source programming language under the GNU General Public License.
The year 1997 witnessed the release of the Comprehensive R Archive Network (CRAN). CRAN contains all executable files, documentation, source code, and packages of R. Initially, CRAN consists of only 3 mirrors and 12 contributed packages. Today, CRAN has 101 mirrors and 18,728 contributed packages. In the year 2000, the ‘stable beta’ version of R was released.
Features of R
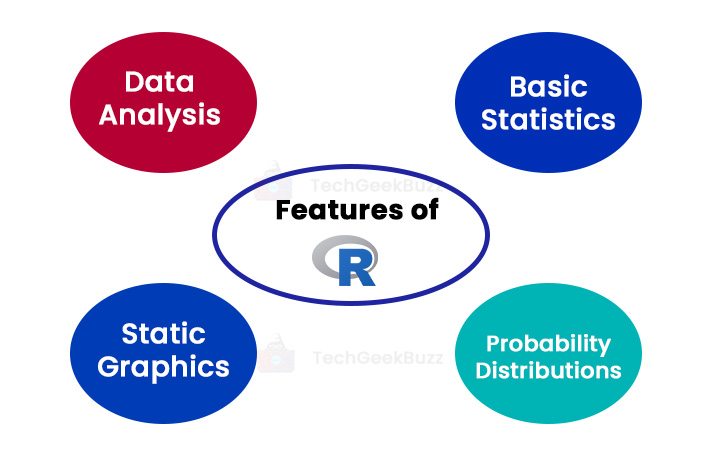
The features of R are categorized into two groups, namely statistical and programming. Let us discuss the statistical and programming features of R below. Statistical Features of R
- Basic Statistics: With R, it becomes pretty easy to measure the ‘Measures of Central Tendency”. The “Measures of Central Tendency” are mean, mode, and median.
- Probability Distributions: In statistics, probability distributions play a crucial role. With R, you can easily manage different sorts of probability distributions, such as Chi-squared distribution, Binomial distribution, normal distribution, and many others.
- Static Graphics: R comes with support for creating static graphics. It supports a wide variety of plot types, including biplots, mosaic plots, graphics maps, and others, to name a few.
- Data Analysis: R provides a set of tools for performing data analysis.
Programming Features of R
- Distributed Computing: The two packages of R, namely ddR and multidplyr, supports distributed computing.
- R Packages: R has the Comprehensive R Archive Network (CRAN), which consists of 101 mirrors and 18,728 contributed packages.
Advantages of R
The following are the upsides of R:
- R is an open-source programming language and software environment, and anyone can use it without spending a penny.
- It is a cross-platform software environment compatible with Windows, macOS, and UNIX-like systems.
- R is a platform-independent language. Meaning that any R program developed on one system can run on other operating systems without any modifications.
- It simplifies high-quality plotting and creating graphs. R libraries, such as ggplot2 and plotly, make it easy to create visually attractive graphs and plots.
- R provides packages that simplify machine learning and data science operations.
- It is a constantly evolving programming language.
Disadvantages of R
The following are the drawbacks of R:
- R does not focus much on memory management. It needs the entire data in one place, i.e., in the memory, Therefore, R consumes more memory.
- It has a steep learning curve.
- R does not support dynamic or 3D graphics.
- It is quite slower than other languages, such as Python and MATLAB.
- It lacks security.
When to Choose R?
Data miners, data analysts, statisticians, and researchers across the globe choose R for statistical computing and graphics. They use R for retrieving, cleaning, and analyzing data and presenting the insights extracted from the analysis process. R is ideal to choose when you have a limited amount of data to process.
Moreover, R comes with an array of libraries and tools for cleaning and prepping data, training and evaluating machine learning algorithms, and creating visually appealing insights from data sets.
What is SAS?
SAS, also known as Statistical Analysis System, is a statistical software suite. This software suite is intended for advanced analytics, data manipulation, crime investigation, business intelligence, multivariate analysis, and predictive analytics. It is a platform-independent software suite that is compatible with Windows, OpenVMS Alpha, IBM mainframe, and Linux operating systems.
The SAS software suite is capable of mining, altering, managing, and retrieving data from multiple sources, and performing statistical analysis on it. More interestingly, non-technical users can take advantage of SAS’s graphical point-and-click user interface, called SAS Enterprise Guide, to perform data analysis.
There is no need to have SAS programming experience while working with SAS Enterprise Guide. It automatically generates code or performs data analysis.
SAS programs generally consist of steps categorized into two groups, namely DATA and PROC. The DATA steps focus on collecting and retrieving data, and the PROC steps focus on analyzing data.
Moreover, SAS comes with the Output Delivery System through which we can publish SAS data in PDF, HTML, Excel, and many other formats. The SAS software suite has more than 200 components, with the popular ones listed as follows:
- SAS/STAT: Statistical Analysis
- SAS/OR: Operations Research
- Enterprise Miner: Data Mining
- SAS/ETS: Econometrics and Time-series Analysis
- SAS/AF: Applications Facility
- Enterprise Guide: GUI-based Code Editor & Project Manager
- SAS/GRAPH: Graphics and Presentation
- SAS/QC: Quality Control
History
The development of SAS began in the late 1960s. At that time, eight Southern universities came together with the aim to develop statistical analysis software for analyzing agricultural data to improve crop yields.
Anthony Barr and James Goodnight developed the software’s statistical routines and became the leaders of the project. In 1968, they invented the integrated new multiple regression and analysis of variance routines. The year 1972 witnessed the first release of SAS. In the same year, the project lost its funding.
All the first versions of SAS were named after the years in which they were released. SAS 71 was released in 1971 and was only compatible with the IBM mainframe. This version of SAS introduced DATA steps and PROC steps. In the following year, SAS 72 was released with the introduction to the MERGE statement and support for combining datasets. After that, three variants of the SAS version were released, SAS 76, SAS 79, and SAS82.
With time, multiple versions of SAS were released, and the latest version of SAS is 9.4M7.
Features of SAS
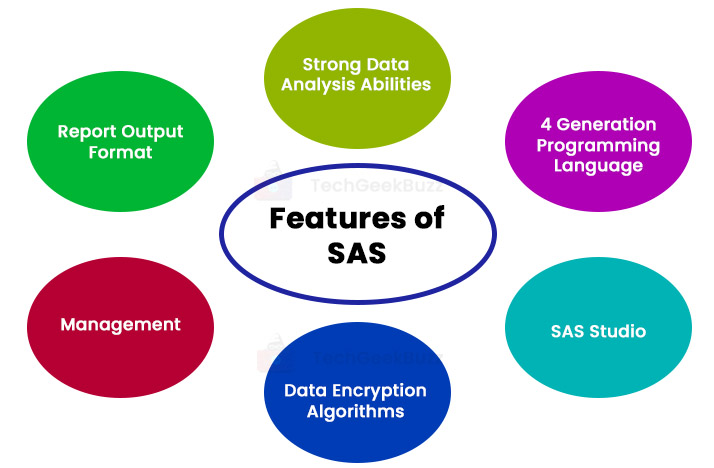
The following are the remarkable features of SAS:
- Strong Data Analysis Abilities: SAS is a comprehensive and complete package for performing data analysis, from simple statistics through advanced levels. It comes with built-in libraries that provide everything you need to analyze and report data.
- 4 Generation Programming Language: SAS is a 4 generation programming language. The syntax of the SAS language is analogous to simple statements for providing instructions to the system. It comes with a log window, which constantly instructs the user, provides notes, and marks errors.
- SAS Studio: SAS Studio is a web development application for SAS. You can access this web application through any browser from anywhere. In addition, it does not require client installation. SAS Studio enables you to access data files, existing programs, and libraries and write new programs.
- Data Encryption Algorithms: SAS 9.4 comes with the SAS/SECURITY feature, which guarantees that security is the top priority while granting access. It also allows you to encrypt SAS data on disk through various encryption algorithms.
- Management: SAS has a SAS Environmental Manager that is responsible for alerting, monitoring, and managing the analytics environment.
- Report Output Format: SAS enables you to display the results of analytics and provides a number of reporting choices. You can create and save reports in various standard formats, such as PDF, PowerPoint, and RTF. Moreover, you can also save your reports in the form of eBooks and I-books.
Advantages of SAS
Here are the significant benefits of SAS:
- SAS has a low learning curve, i.e., it is easier to learn than R. It does not require you to have SAS programming experience.
- It can handle large sets of data effortlessly and efficiently.
- The process of debugging in SAS is pretty easy. It has a log window that provides all the errors.
- The SAS Enterprise Guide, a point-and-click GUI, makes data analysis easy and manageable for non-technical users.
- It produces formatted output, which is easily comprehensible.
Disadvantages of SAS
Some downsides of SAS are as follows:
- SAS is an expensive data analytics solution.
- The graphic representation in SAS is poor.
- New rule-based machine learning algorithms are easier to implement in R than in SAS.
- You need SAS Enterprise for text mining.
When to Choose SAS?
SAS is used for various purposes, such as data manipulation, data analysis, statistical analytics, business intelligence, and predictive analytics. You can choose SAS when you have large amounts of datasets.
Also, SAS is the best option to choose if you are from a non-technical background and wish to perform data analysis. It comes with a point-and-click graphical user interface, which makes it easy for you to perform data analysis.
R vs SAS: A Detailed Comparison
The following table highlights how SAS and R differ from each other:
| Parameters | R | SAS |
| Definition | R is a programming language and software environment for statistical computing and graphics developed by the R Core Team. | SAS or Statical Analysis Software is a software suite that integrates tools for data manipulation, advanced analytics, crime investigation, business intelligence, predictive analysis, and multivariable analysis. It is developed by SAS Institute. |
| Cost | It is an open-source software environment, and hence, anyone can use it. | It is a commercial software suite and is expensive. |
| Learning Curve | R has a steep learning curve than SAS since you need to learn the R programming language. | SAS has a low learning curve since there is no need to learn the SAS programming language. The SAS Enterprise Guide is a point-and-click graphical user interface that allows you to perform data analysis without SAS programming experience. |
| Statistical Ability | Since R is an open-source tool, it allows you to create and submit your own packages or libraries. | SAS offers a powerful package that provides all types of statistical techniques. |
| Graphical Support | R has excellent graphical support due to the availability of packages, such as ggplot, RGIS, and Lattice. | This software has limited graphical support compared to R. |
| Debugging | Debugging in R is quite a tricky task. | SAS ensures easy debugging. |
| Data Publishing | With R, you can publish data either in soft or hard copy. | With SAS, you can publish data in various formats, including PDF and Excel through the Output Delivery System. |
| Software Updates | Being an open-source software R gets updated frequently. | SAS does not get updated frequently. |
| File Sharing | We can share R-generated files with others easily. | We cannot share SAS-generated files with other users who do not use SAS. |
| Customer Support | R has an excellent online community but lacks providing dedicated customer support. | SAS provides excellent and dedicated customer support. |
| Users | Renowned companies, such as Instacraft, Adroll, Custora, and Opbandit use R. | Popular companies, such as Asana, Hubspot, StackShare, and Airbnb use SAS. |
R vs SAS: Which is Better?
Both R and SAS are leading data analytics tools used by data scientists and data analysts . SAS is a comprehensive tool for advanced data analytics, data manipulation, predictive analysis, business intelligence, and multivariate analysis. On the flip side, R is a programming language and software environment for statistical computing and graphics.
R is an ideal choice if you have experience working with R or have a sound knowledge of the R programming language. On the contrary, if you are from a non-technical background or new to the world of data analytics, choosing SAS would be an excellent move. SAS comes with a point-and-click graphical user interface, SAS Enterprise Guide, which makes it easy for non-technical users to analyze data.
Conclusion
In this article, we have drawn a detailed comparison between SAS and R. Both these data analytics tools have their own set of features, and thus it would be quite inappropriate to choose SAS over R or vice-versa.
SAS is an ideal tool in the market analytics domain, however, it is quite expensive. On the contrary, R is an open-source tool that is primarily used for educational and research purposes. It is always better to choose between SAS and R depending on your organization’s requirements and budget.
If you have any queries related to this topic, you can post them in the comments section below.
Frequently Asked Questions
1. Which is harder to learn - SAS or R?
SAS is easier to learn than R because if you want to use R, you need to have knowledge of the R programming language. On the flip side, SAS has a point-and-click GUI that enables you to perform data analysis without any previous experience of working with the SAS language. If you have a basic knowledge of SQL, it is quite easy to learn SAS.
2. Is SAS better at managing large volumes of data than R?
Yes, SAS is better at managing large volumes of data than R. The reason behind this is that R requires the entire data in memory. When the data increases in the RAM, it slows down and results in low performance.
3. Does R have better graphics capabilities than SAS?
In terms of graphical capabilities, R outperforms SAS. R comes with various packages, like ggplot, Lattice, and RGIS that help in creating better graphics.
People are also reading: