

A PDF file is generally used to store text, images, and links. Moreover, the text data can be represented in different ways, such as lists, tables, bullet points, and links. While analyzing the data, you might encounter some situations where you have a PDF file, and you need to extract only table data from it.
This article details how to extract PDF tables in Python. Here in this tutorial, we will walk you through the Python library, Tabula-py , to extract tables from a PDF file. Also, we will explain how to write the table data to CSV files, but before we jump to the Python code, let's install the required libraries first.
Installing Dependencies
1. Python
tabula-py
Library
The
tabula-py
library is an open-source Python library that can extract tables from a pdf file and convert them into the pandas DataFrame format. This library is widely used in data analysis. To install the tabula-py library for your Python environment, run the following pip install command:
pip install tabula-py
When you run the above pip install command on your terminal or command prompt, it will install all the other required libraries, like pandas and numpy, so you do not need to install them separately.
2. A PDF File
As we will be extracting tables from a PDF file, so we require a PDF file for this tutorial. You can either use the PDF file present in your system or the URL for the PDF. For this tutorial, we have downloaded the food calories list pdf and saved it in the same directory where our Python script is located.
How to Extract PDF Tables in Python?
So let's begin with importing the required modules.
from tabula import read_pdf
Now set an identifier,
pdf_file
, that can either be the path or URL for the PDF file.
pdf_file="Food Calories List.pdf"
Now let's parse through the pdf file and extract all the tables present in the file using the
read_pdf()
function of tabula.
#list all tables
tables = read_pdf(pdf_file, pages='all')
The
read_pdf()
function will completely read the
pdf_file
and extract all the tables from the
all
pages. We can also specify the specific page number, such as
pages=3
, and grab the tables from page number 3.
If the value of the pages parameter is all, the
read_pdf()
function will return a
Python list
of pandas DataFrames. Now, we can loop through the list of all
tables
and convert all the tables from
dataframes
to
CSV
files.
table_number =1

for table in tables:
    #remove Nan columns
    table = table.dropna(axis="columns")

    if not table.empty:
        print(f"Table {table_number}")
        print(table)

        #convert the table dataframe into csv file
        table.to_csv(f'table{table_number}.csv')

        table_number += 1
-
dropna(axis="columns")is the pandas DataFrames function that will remove all NaN value columns from the data frame. -
The
.emptydata frame attribute returns the Boolean valueTrueif the data frame is empty, else it returnsFalse. -
to_csv()is also a pandas DataFrame function that converts a DataFrame data to a CSV file and saves it locally.
We have also used the
table_number
Python identifier in the above program to just count the number of non-empty tables. Now put all the code together and execute.
Program to Extract PDF Tables in Python and Convert Them Into CSV
from tabula import read_pdf, convert_into

pdf_file="Food Calories List.pdf"
#list all tables
tables = read_pdf(pdf_file, pages='all')

table_number =1

for table in tables:
    #remove Nan columns
    table = table.dropna(axis="columns")

    if not table.empty:
        print(f"Table {table_number}")
        print(table)

        #convert the table dataframe into csv file
        table.to_csv(f'table{table_number}.csv')

        table_number += 1
Output
Table 1
              BREADS & CEREALS  ... energy content
0          Bagel ( 1 average )  ...         Medium
1           Biscuit digestives  ...           High
2                   Jaffa cake  ...       Med-High
3    Bread white (thick slice)  ...         Medium
4      Bread wholemeal (thick)  ...        Low-med
5                     Chapatis  ...         Medium
6                   Cornflakes  ...       Med-High
7                 Crackerbread  ...    Low Calorie
8               Cream crackers  ...  Low / portion
9                     Crumpets  ...        Low-Med
10   Flapjacks basic fruit mix  ...           High
11           Macaroni (boiled)  ...    Low calorie
12                      Muesli  ...       Med-high
13         Naan bread (normal)  ...         Medium
14            Noodles (boiled)  ...    Low calorie
15     Pasta ( normal boiled )  ...    Low calorie
16   Pasta (wholemeal boiled )  ...    Low calorie
17  Porridge oats (with water)  ...    Low calorie
18         Potatoes** (boiled)  ...    Low calorie
19          Potatoes** (roast)  ...         Medium

[20 rows x 4 columns]
Table 2
              Lentils (boiled)      150 calories  100 calories        Medium
0                      Lettuce        4 calories   15 calories      Very Low
1                        Melon       14 calories   28 calories        Medium
2   Mushrooms raw one\raverage            3 cals       15 cals  Very low cal
3           Mushrooms (boiled)       12 calories   12 calories   Low calorie
4            Mushrooms (fried)      100 calories  145 calories          High
5                       Olives       50 calories   80 calories   Low calorie
6               Onion (boiled)       14 calories   18 calories   Low calorie
7                One red Onion           49 cals       33 cals   Low calorie
8                Onions spring            3 cals       25 cals  Very low cal
9                Onion (fried)       86 calories  155 calories          High
10                      Orange       40 calories   30 calories   Low calorie
11                        Peas      210 calories  148 calories        Medium
12         Peas dried & boiled      200 calories  120 calories   Low calorie
13                       Peach       35 calories   30 calories   Low calorie
14                        Pear       45 calories   38 calories   Low calorie
15               Pepper yellow            6 cals       16 cals      Very low
16                   Pineapple       40 calories   40 calories   Low calorie
17                        Plum       30 calories   39 calories   Low calorie
18                     Spinach        8 calories    8 calories   Low calorie
19    Strawberries (1 average)       10 calories   30 calories   Low calorie
20                   Sweetcorn       95 calories  130 calories        Medium
21        Sweetcorn on the cob       70 calories   70 calories   Low calorie
22                      Tomato       30 calories   20 calories   Low calorie
23               Tomato cherry  6 cals ( 3 toms)       17 Cals  Very low cal
24                Tomato puree       70 calories   70 calories    Low-Medium
25                  Watercress        5 calories   20 calories   Low calorie
Table 3
             Milk & Dairy produce
0                  Cheese average
1   Cheddar types average reduced
2                             fat
3          Cheese spreads average
4          Cottage cheese low fat
5                  Cottage cheese
6                    Cream cheese
7                Cream fresh half
8              Cream fresh single
9              Cream fresh double
10            Cream fresh clotted
11                        Custard
12         Eggs ( 1 average size)
13                     Eggs fried
14                  Fromage frais
15                      Ice cream
16                     Milk whole
17              Milk semi-skimmed
18                   Milk skimmed
19                      Milk Soya
20                Mousse flavored
21           Omelette with cheese
22              Trifle with cream
23                 Yogurt natural
24             Yogurt reduced fat
Table 4
                   Fats & Sugars  ... energy content
0                       PURE FAT  ...           High
1                     Bombay mix  ...           High
2                         Butter  ...           High
3                    Chewing gum  ...    Low calorie
4                      Chocolate  ...           High
5                  Cod liver oil  ...           High
6                     Corn snack  ...           High
7      Crisps (chips US) average  ...           High
8                          Honey  ...         Medium
9                            Jam  ...         Medium
10                          Lard  ...           High
11                Low fat spread  ...           High
12                     Margarine  ...           High
13                      Mars bar  ...       Med-High
14                   Mint sweets  ...           High
15  Oils -corn, sunflower, olive  ...           High
16               Popcorn average  ...           High
17       Sugar white table sugar  ...         Medium
18               Sweets (boiled)  ...       Med-High
19                         Syrup  ...         Medium
20                        Toffee  ...           High

[21 rows x 4 columns]
Table 5
                             Fruit  ... Water Content
0                Apple (1 average)  ...          85 %
1                    Apple cooking  ...          88 %
2                          Apricot  ...          85 %
3                          Avocado  ...          60 %
4                           Banana  ...          75 %
5                Blackberries each  ...          85 %
6                Blackcurrant each  ...          77 %
7          Blueberries  (new) 100g  ...          81 %
8                      Cherry each  ...          83 %
9                       Clementine  ...          66 %
10                        Currants  ...          16 %
11                          Damson  ...          70 %
12             One average date 5g  ...          14 %
13  Dates with inverted sugar 100g  ...          12 %
14                            Figs  ...          24 %
15                    Gooseberries  ...          80 %
16            Grapes 100g Seedless  ...          82 %
17            one average Grape 6g  ...          82 %
18                Grapefruit whole  ...          65 %
19                           Guava  ...          85 %
20                            Kiwi  ...          75 %
21                           Lemon  ...          85 %
22                         Lychees  ...          80 %
23                           Mango  ...          80 %
24           Melon Honeydew (130g)  ...          90 %
25         Melon Cantaloupe (130g)  ...          93 %
26                      Nectarines  ...          80 %
27                          Olives  ...          63 %

[28 rows x 4 columns]
Table 6
                      Orange average     35 calories  8.5  73 %
0                  Orange large 350g        100 Cals  22g  75 %
1       Papaya Diced (small handful)  67 Cals  (20g)  17g     -
2                      Passion Fruit     30 calories    3  50 %
3                            Paw Paw     28 calories    6  70 %
4                              Peach     35 calories    7  80 %
5                               Pear     45 calories   12  77 %
6                          Pineapple     50 calories   12  85 %
7                               Plum     25 calories    6  79 %
8                             Prunes      9 calories  2.2  37 %
9                            Raisins      5 calories  1.4  13 %
10                  Raspberries each    1.1 calories  0.2  87 %
11                           Rhubarb      8 calories  0.8  95 %
12          Satsuma one average 112g         29 cals  6.5  88 %
13                     Satsumas 100g     35 calories  8.5  88 %
14          Strawberries (1 average)    2.7 calories  0.6  90 %
15                          Sultanas      5 calories  1.4  16 %
16                         Tangerine     26 calories    6  60 %
17         Tomatoes (1 average size)          9 cals  2.2  93 %
18  Tomatoes Cherry (1 average size)      2 calories  0.5  90 %
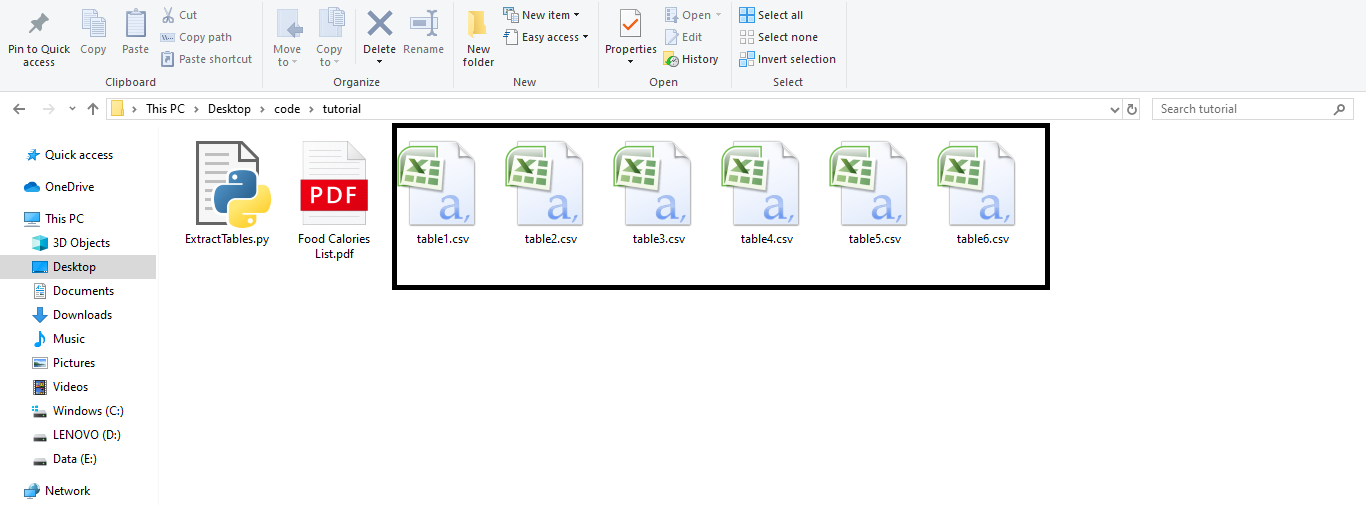
When you execute the above code, you will see a similar output, and you can also check your working directory if all the tables were saved or not as CSV files.
Conclusion
In this Python tutorial, we learned how to extract PDF files in Python using the tabula library and convert them into CSV files with only a few lines of code. This is the beauty and power of Python and its libraries that we can crunch data and analyze it in a few lines of code.
We recommend you read the official documentation of tabula-py to know more about this powerful Python library. We have also written a tutorial on how to extract images and links from a PDF. You can read these articles and expand your knowledge about working with PDFs in Python:
People are also reading: