

Power BI and Tableau are two popular data visualization tools that primarily focus on business intelligence (BI). They collect data from heterogeneous sources, integrate data, analyze the integrated data, and create visually immersive insights out of it. In other words, Power BI and Tableau help users to perform data analysis, data manipulation, and data visualization to make the most out of the business data. This article intends to draw a detailed comparison between Power BI and Tableau so that it becomes easy for you to pick the best data visualization tool that fits your requirements. Also, it walks you through the features, advantages, and disadvantages of both Power BI and Tableau. So without further ado, let’s get started!
What is Power BI?
Power BI is a widely used data visualization software developed by Microsoft that primarily focuses on business intelligence. It is a suite of software applications, services, and connectors that work collectively to transform data from heterogeneous sources into interactive and visually appealing insights. Data may be from an excel spreadsheet, database, webpage, or cloud-based or on-premises data warehouses. With Power BI, you can quickly and easily connect to your data sources, analyze the data, convert it into visually immersive insights, and share those insights with anyone you wish. This data visualization tool is a part of the Microsoft Power Platform. The Power BI ecosystem consists of multiple components that are as follows:
- Power BI Desktop
The Power BI Desktop is a Windows-based desktop application for creating reports.
- Power BI Service
The Power BI Service is a Software-as-a-Service (SaaS).
- Power BI Mobile Apps
The Power BI Mobile Apps is an application for Android, iOS, and Windows devices.
- Power BI Report Builder
You can create paginated reports using The Power BI Report Builder and share them in the Power BI Service.
- Power BI Report Server
The Power BI Report Server is an on-premises report server for publishing your reports created in the Power BI Desktop.
- Power BI Gateway
The Power BI Gateway synchronizes external data in and out of Power BI.
History
Thierry D'Hers and Amir Netz first introduced the Power BI software in 2011. They both were part of the SQL Server Reporting Services at Microsoft. However, Ron George originally designed Power BI in 2010 and named it Project Crescent. Project Crescent was available publically and bundled with SQL Server Codename Denali. Later, Microsoft renamed Project Crescent to Power BI and unveiled it in September 2013 as Power BI for Office 365. The Power BI’s first release was based on Microsoft Excel’s add-ins, namely Power Query, Power Pivot, and Power View. Microsoft added many other advanced features to Power BI, such as enterprise-level data connectivity, Questions and Answers, security options via Power BI Gateways, and many others. In July 2015, Microsoft released Power BI to the general public for the first time.
Features of Power BI
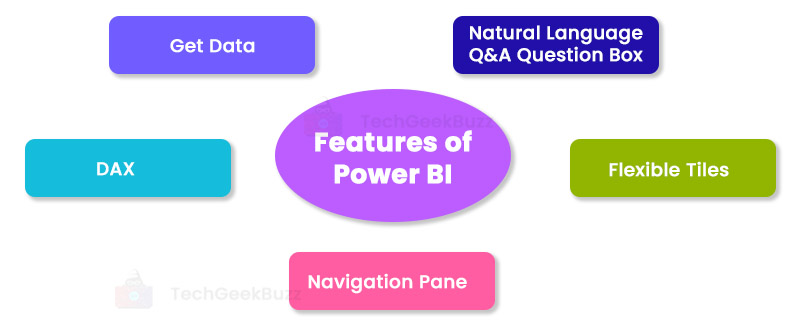
The following are the salient features of Power BI:
- Get Data: The Get Data feature of Power BI allows users to collect data from an array of sources, such as on-premises and cloud data warehouses, databases, and Excel spreadsheets. Some popular data sources supported by Power BI are MySQL, SQL Server, Excel, Azure, text/CSV files, PDFs, and Oracle.
- Natural Language Q&A Question Box: Question & Answer Box is a unique feature of Power BI, where users can ask questions in natural language to search for data available in the Power BI system. Power BI has cognitive engines that respond to user queries by searching and providing the requested data.
- Flexible Tiles: A tile in Power BI is a single block that contains visualization in your Power BI’s dashboard. Tiles help you separate visualizations to get a clear view. You can adjust the tiles anywhere on a Power BI dashboard and resize them as per your requirements.
- Navigation Pane: This feature allows you to easily navigate through datasets, dashboards, and reports available in the Power BI system.
- DAX: DAX stands for Data Analysis Expression. It is a collection of functions, constants, and operators that assist in creating formulas and expressions in Power BI. It helps you create new information from data already available in your model.
Advantages of Power BI
Some remarkable advantages of Power BI are:
- Power BI has a simple interface, and hence, it is beginner-friendly and easy to use.
- It is a cost-effective data visualization tool since the Power BI Desktop is free. Also, the Power BI Desktop lets you create detailed reports and share them with anyone you wish.
- Microsoft updates its products frequently. Therefore, you can experience new features of Power BI with frequent updates.
- Power BI provides excellent accessibility to data sources. Also, it allows you to access data sets that you create while designing reports.
- It allows you to create a wide range of interactive and attractive data visualizations, such as a line chart, area chart, clustered and stacked bar chart, clustered and stacked column chart, map, pie chart, and others, to name a few.
Disadvantages of Power BI
Here are some significant drawbacks of Power BI:
- Power BI is not compatible with macOS systems.
- It does not support files having a size greater than 1 GB.
- Processing large amounts of data with Power BI can sometimes degrade the performance or may crash the Power BI system.
- Though Power BI has a user-friendly interface, it is crowded. It means that there are several icons and options on the interface that block the view of the dashboard.
When to Choose Power BI?
If you are a beginner and want to create alluring visualizations with a limited amount of data, Power BI is a perfect option to go with.
What is Tableau?
Tableau is also a popular data visualization tool with a primary focus on business intelligence. It is a leading end-to-end visual analytics platform that is transforming the way businesses and organizations are using data. It provides them an easy and quick way to explore and manage data, discover insights from it, and share them with others. The tools in Tableau for data analytics are categorized into two groups, namely developer tools and sharing tools. Let us briefly talk about these two categories below.
Developer Tools
The developer tools are the tools used for creating dashboards, reports, visualization, and charts. Tools that fall under this category are the Tableau Desktop and the Tableau Public.
- Tableau Desktop
The Tableau Desktop enables you to create reports and charts and blend them together to create an interactive dashboard. In addition, it provides connectivity to data warehouses and other data sources for live data analysis.
- Tableau Public
The Tableau Public is a free version of Tableau with some limitations. With this version, you can save your creations only on Tableau’s public cloud. This version is best for those who wish to learn Tableau.
Sharing Tools
The sharing tools are the tools used for sharing the charts, visualizations, reports, and dashboards created using the developer tools. Tableau products that fall under this category are Tableau Online, Tableau Server, and Tableau Reader.
- Tableau Online
This is an online sharing tool, having functionalities similar to the Tableau Server, but the data is stored on the server hosted in the cloud.
- Tableau Server
The Tableau Server enables users to share visualizations created in the Tableau Desktop across their organizations. However, before sharing the visualizations, you must first have to publish them in the Tableau Desktop.
- Tableau Reader
The Tableau Reader lets users view visualizations created using Tableau Desktop or Tableau Public.
History
Tableau was introduced as a computer science project at Stanford that intended to improve the flow of data analysis and make data more accessible to people through visualizations. Pat Hanrahan, Chris Stolte, and Cristian Chabot are the founders of Tableau. They developed Tableau’s foundational technology, VizQL. It has an intuitive interface that visually expresses data by translating drag-and-drop actions into data queries.
Features of Tableau
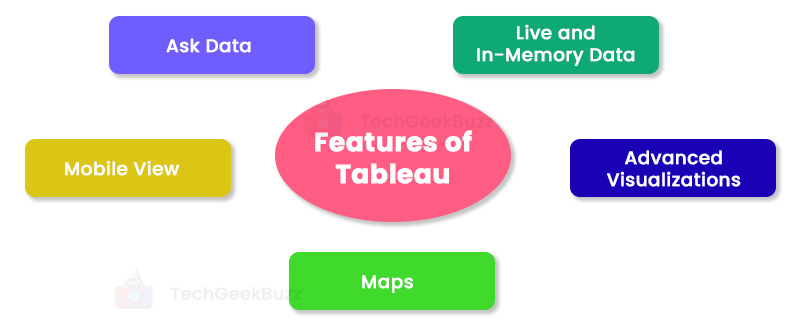
The key features of Tableau are as follows:
- Live and In-Memory Data: Tableau enables you to establish live connections with external data sources as in-memory data and use that data directly. Otherwise, you can store that data in memory and use it as per your requirements.
- Advanced Visualizations: Like Power BI, Tableau also offers a wide range of data visualizations, such as a bar chart, pie chart, histogram, Gantt chart, treemap, boxplot, motion chart, and bullet chart.
- Maps: A map is yet another unique feature of Tableau that consists of pre-installed information, such as cities, postal codes, administrative boundaries, etc. Moreover, you can add additional information to maps in Tableau as per your requirements.
- Mobile View: There is a Tableau application compatible with mobile devices. This application lets you view your dashboards and reports on your mobile devices.
- Ask Data: This feature allows you to type a query for your data and provides the most relevant answers in the form of visualizations.
Advantages of Tableau
The following are the notable benefits of Tableau:
- Tableau has excellent community support.
- It supports a myriad of data sources, such as on-premises files, relational databases, non-relational databases, data warehouses, cloud platforms, and data processing platforms.
- Tableau allows easy collaboration with other users and sharing visualizations with them in the form of sheets and dashboards.
- Tableau ensures the robust security of available data. It comes with a robust security system based on authentication and permission for user access and data connections.
- This data visualization tool can handle huge volumes of datasets.
Disadvantages of Tableau
The downsides of Tableau are as follows:
- Tableau is an expensive data visualization solution.
- Once you publish your reports and dashboards, you cannot go back to the data you used for those reports or dashboards.
- It can only display 16 columns, and hence, users may find it difficult to work with large datasets.
- With Tableau, it becomes quite challenging to embed reports in other environments.
When to Choose Tableau?
If you wish to create attractive visualizations out of a colossal amount of data, Tableau is the best choice. However, to use Tableau, you need to have sound knowledge of data analysis. Also, Tableau is not ideal for beginners.
Power BI vs Tableau - A Detailed Comparison
The following table highlights the key differences between Power BI and Tableau:
| Parameters | Power BI | Tableau |
| Development | Ron George originally designed Power BI in 2010, and Thierry D'Hers and Amir Netz introduced it to the public in 2011. | Tableau was founded by Pat Hanrahan, Christian Chabot, and Chris Stolte in 2003 at Stanford University. |
| Components | The Power BI ecosystem consists of Power BI Desktop, Power BI Service, Power BI Mobile Apps, Mobile BI Gateway, Power BI Report Builder, and Power BI Report Server. | The components of Tableau are Tableau Desktop, Tableau Public, Tableau Online, Tableau Reader, and Tableau Server. |
| Amount of Data | This tool is ideal to use when you have a limited amount of data. | Tableau works well with vast volumes of data. |
| Performance | Power BI can slow down when it handles bulk data. | It offers high performance even though it works with bulk data. |
| Programming Support | For data manipulation and data modeling, Power BI supports M language and Data Analysis Expression (DAX). In addition, Power BI can connect to the R language through Microsoft Revolution Analytics, but it is only available for enterprise-level users. | Tableau integrates with the R language much better than Power BI. Moreover, it enables us to create data visualization using C, C++, Java, and Python languages. |
| Data Sources | Some popular data sources supported by Power BI are Microsoft Excel, MS SQL Server, Oracle, PostgreSQL, IBM DB2, MySQL, CSV and text files, and Access DB. | Some popular data sources supported by Tableau are Microsoft Excel, text files, JSON, Amazon Redshift, Google Analytics, Cloudera, Hadoop, Dropbox, Google Sheets, and Google Docs. |
| Cost | Power BI is less expensive than Tableau since the monthly subscription of Power BI Professional costs less than $10 per user. | Tableau is expensive because its Pro version requires a monthly subscription that costs more than $35 per user. |
| Ideal for | Power BI is ideal for small and medium-sized organizations. | Tableau is ideal for medium and large-sized organizations. |
| Operating system | This data visualization tool can only run on Windows since it is a Microsoft product. | This tool is compatible with Windows and macOS platforms. |
| Community | Power BI has a smaller community compared to Tableau. | Tableau has excellent community support. |
| Users | Beginners and experienced people can use Power BI. | Only experienced users and analysts use Tableau for data analytics. |
| Embedding Reports | Embedding reports to different environments is pretty easy in Power BI since it provides the Embed option. | It is quite challenging in Tableau to embed reports in different environments. |
Power BI vs Tableau - Which is Better?
Both Power BI and Tableau are feature-rich data visualization tools. However, the choice between Power BI and Tableau entirely depends on the size of an organization, the experience of a user, and the volume of data being used. Power BI has an intuitive and beginner-friendly interface, whereas Tableau’s UI is not so user-friendly. However, Tableau offers excellent speed even when dealing with huge data. Choosing Power BI would be an ideal choice if you wish to perform data analysis but don’t have much knowledge as a data analyst . On the contrary, Tableau is an ideal option to choose if you have a sound knowledge of data analysis and data visualization. Therefore, Power BI is the best choice for its ease of use and Tableau for its speed and capability to process large volumes of data.
Conclusion
Through this article, we have covered all major differences between Power BI and Tableau. Both these tools are widely adopted for creating appealing and attractive data visualization. To choose between Power BI and Tableau, consider parameters such as the amount of data, the size of your organization, and of course, your experience working with data. Power BI works well with a limited amount of data and is best suited for small and medium-sized organizations. Also, it is a perfect choice for beginners who wish to create data visualizations. On the contrary, Tableau is a better option for experienced users and analysts. It can manage large volumes of data and is an ideal tool for medium and large-sized organizations.
People are also reading: