

Almost every one of us depends on the internet today; thus, we share data directly or indirectly. WhatsApp, Facebook, Instagram, Google, Uber, and Zomato – all of them and others continuously mine user data to know more about the user and provide them with a better web experience each time.
The processing and modeling of data to solve real-world problems are what Data Science is all about.
Who Can Learn Data Science?
Whether you are from a math background, whether you have worked with SQL or a programming language before, or if you love to crack puzzles and can find links, patterns, and behaviors – data science is for you.
How?
Data science can be performed with ease using tools. There are various tools for programmers (or those with programming knowledge) and business analysts (who may not have programming knowledge). For example, Hadoop, Python, R, SQL, etc., are some tools used by programmers. In contrast, business users use tools like Rapid Miner, KNIME, PowerBI, etc. Learning at least a few of these data science tools will cover a considerable part of your data science learning journey.
Many tools like R, Python, RapidMiner, Tableau, and Power BI help with each stage of data science that can be automated – data preparation, performing analysis, applying algorithms, and data visualization. We will discuss, step by step, the tools that can be used at each stage.
Apart from the ones mentioned in this article, there are many more tools available in the market, each with its features and benefits, but these are the most popular, and learning them will never be a waste of time (ever!).
So, how is data science done?
Data science is vast and seems complex. But, when broken down into sub-stages, you will notice that all you need is thorough technical knowledge and good organizational skills. The main steps involved in data science are –
- Data collection and problem creation
- Data wrangling (data munging or data preparation)
- Data mining and Machine learning
- Data visualization
- Generating potential business solutions
Best Data Science Tools
Each of these steps requires a different set of tools based on the type of business problem, and in this article, we will learn about the tools used in each step.
1. Data collection and problem-creation tools
Every business evolves through innovation. If you start a simple ‘Dosa’ business and after two years, you are still selling the same Dosa without any improvements, someone else who also started giving ‘Cheese Dosa’ or ‘Maggi Dosa’ will steal your chances of giving better services. Constant upgradation and innovation are essential for the success of a business.
But how will you know what to do? – By knowing your customers!
Ask for feedback and suggestions from your customers, know how your competitors are doing, know if your employees are happy, and so on. Here are some questions that you can ask –
- Why do people like my product? (Uniqueness)
Maybe the chutney has that extra smooth texture and the subtle touch of homemade food.
- Who are my customers? How can I increase my customer base? (Expansion)
Mostly office goers who stay away from home (let us say the age group of 25-35 years) and need quick bites to eat dosas. How about catering to college students and senior citizens?
- Is there a target audience that does not like my product? Why? (Feedback)
Maybe the side dishes like chutney or spice powder are too spicy for kids. How about including kid-friendly dosas with loads of cheese, fresh tomato sauce, and less spicy gravies?
- How can I improve my services to attract more consumers? What are my competitors doing?
Collect more data! The dosa seller on the next street has introduced a ‘customizable dosa’ platter, where customers can choose how they want their Dosa… What can I do?
The essence of the entire problem-solution chain is the collection of relevant data and channelizing it to solve complex business problems.
How is Data Collected?
Data collected from each consumer is called raw data. If such complex business problems as the above were to be solved, data from many such consumers must be collected and processed. That is why it is referred to as Big Data.
Big data collection can be quantitative or qualitative and can be done in many ways –
- Querying the existing internal database
- Purchasing external datasets that contain potentially valuable information
- Conducting case studies and interviews
- Surveys, questionnaires, community forums, and feedback forms
- Collecting data through CRM software and transferring it into a file with .csv or. xl format
Data collection is essential and should be comprehensive. If not done correctly, the analysis could be skewed, leading to useless or ineffective results for the business.
What is Data Wrangling?
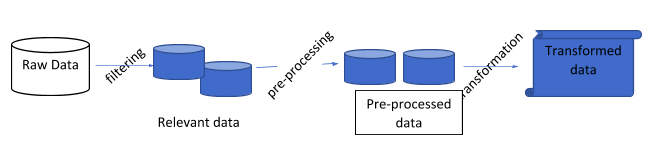
The raw data collected is not always perfect and needs to be made suitable for further processing. The process of extracting valuable details by cleansing and filtering relevant data and enriching it for further exploratory analysis is called as data preparation or data ‘wrangling’. The quality of the final data depends on this step.
Data Science Tools to Handle Big Data
Analyzing massive amounts of data is impossible unless organized and stored correctly. What you receive from different sources (data collection) is raw data that has to be transformed and mapped into a more appropriate and usable format – known as data munging (or preparation or wrangling).
Querying the database and collecting relevant information becomes much faster when data is organized well. For example, you can collect data on how much sales your Dosa shop makes on the weekend vs. during weekdays, what the most popular items ordered, what times of the day see more traffic/sales – do people prefer dosas during morning or evening or night, and so on.
The most popular tools to handle big data are –
1. SQL
Using SQL to query and fetch data is the traditional and robust way and works well. SQL has many features to filter, query, and fetch the records as required. However, it is costly and comes with a complex setup procedure.
2. MongoDB

It is the most popular type of NoSQL that offers high performance and has a cloud-based infrastructure. The schemas are dynamic, unlike in SQL, making it an excellent choice for data analysis.
3. Neo4j

Neo4j is a big data tool that follows the structure of a graph database, i.e., storing graphs like demographic patterns, social networking issues, etc. It offers high availability and is scalable and flexible. Moreover, it supports graphs of the query language (Cypher).
Data Preparation or Data Wrangling Tools
It is essential to prepare data for analysis; you can do this with data wrangling . For instance, there might be some information missing in the newly collected data or the existing data may be insufficient to conclude. Raw data is extracted from various sources and is then formatted, parsed, sorted, filtered, cleansed, arranged into appropriate data structures, and stored in the database or other storage systems for analysis.
As datasets are not usually in a perfect state, they can contain many errors; your focus while cleaning and preparing data should be on answering just one question – What am I trying to learn or achieve by cleaning this data? If that’s in your mind, the task becomes more accessible. The following are the best tools for cleansing and data preparation:
1. Apache Spark and Hadoop
Both Spark and Hadoop are open-source tools developed specifically to handle big data. Both offer impressive performance. While Hadoop is a low-cost tool, Spark is faster than MapReduce used by Hadoop. Also, Spark can process data in real time.
2. Microsoft Excel
Information pre-processing is relatively easy with Excel spreadsheets. You can use it for cleaning, filtering, slicing, and applying formulae on relatively more minor datasets. Also, Excel can seamlessly integrate with SQL. Excel is irreplaceable when it comes to analyzing and providing insights on smaller sets of data (not big data).
3. SAS Data Preparation
This is an excellent tool for non-programmers, and it offers a user-friendly interface that allows you to perform tasks with a single click. The tool helps save a lot of time and improves your overall productivity. Also, it allows you to visually explore and load data sets from .csv, text, Hadoop, and other sources. SAS also lets you define templates you can use later for another analysis. SAS is a costly tool ideal for business analysts working in large organizations.
4. Python

Being the most popular programming language and data preparation or cleaning tool, Python cleans and transforms data quickly and efficiently. Python has an extensive library, known as Pandas, for data analysis and manipulation. There are many other features of python that we will discuss further in this article.
5. Power BI
Microsoft PowerBI is a self-service tool that helps you build a single repository by formatting, remapping, schematizing, and transforming received data. The final data is consistent and ready to use for further analysis. PowerBI uses dataflows to easily run the data preparation logic cutting down the time and cost for data preparation.
6. Alteryx

With Alteryx, you can perform data preparation visually. You can prepare data sources and cleanse, format, join, transpose, and enrich the datasets from the raw data in less time. This allows you to spend more time on analytics than on preparation. Alteryx is costlier than the other options that we have discussed so far.
7. Trifacta
Trifacta’s data wrangling software helps in self-service data preparation and exploration. The connectivity framework of the software connects various sources like Hadoop, cloud services, .cvs, .xml, .txt, or other files and relational databases securely and wrangles them to be used across platforms.
Data Transformation Tools
Data transformation and data wrangling are similar processes used in different contexts. While business analysts do data wrangling, executives, and non-technical professionals, data transformation (Extract-Transform-Load (ETL)) is done by skilled IT professionals who have been dealing with data for quite some time. In today’s businesses, ETL and wrangling go hand-in-hand.
Companies leverage both so that data transformation is accessible from the data source, and business executives can still have the flexibility to check the insights they want quickly. This approach gives better precision for critical projects. Some popular ETL tools are as follows:
1. Microsoft SQL Server Integrated Services (SSIS)

SSIS is a flexible and fast tool for data transformation, including cleaning, joining, and aggregating data. It can merge data from many data stores and standardize it. The tool performs well and can migrate over millions of records in a few seconds.
2. Oracle Data Integrator
With a friendly graphical interface, ODI simplifies the data transformation process through its declarative rules-driven approach for great performance at a low cost.
3. SAS Data Integration Studio
This visual studio is a part of the SAS tool for data science. It is a powerful tool that integrates data from multiple sources and builds and visualizes the entire data integration process.
4. SAP Data Integrator
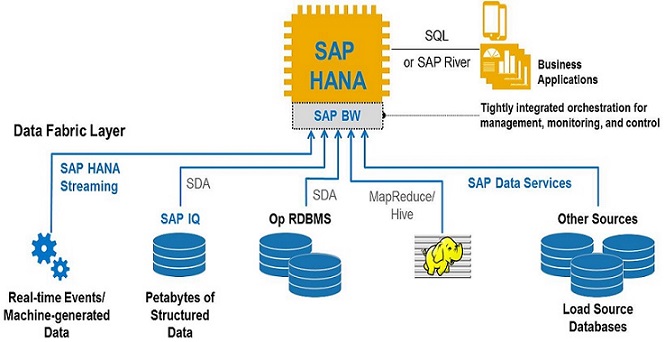
SAP Data Integrator makes the process of data migration accurate and fast. Scalability is another plus point of this tool. Also, compared to other systems, SAP integrators can quickly return answers to complex queries. It provides support for bulk-batch ETL and enhanced support for text processing. However, its price is a bit higher than other tools.
5. Matillion

Matillion has been developed explicitly for transforming cloud data warehouses. It can extract and load data from APIs, applications, SQL, and NoSQL databases. The tools can transform the data to become suitable for use with ML algorithms for deeper analysis.
6. Informatica PowerCenter

Informatica is database neutral and hence can transform data from any source. It is a complete data integration platform that can perform data cleansing, profiling, transforming, and synchronization.
Exploratory Data Analysis (EDA) Tools
EDA is a concept of statistics where you can analyze data sets to obtain main characteristics, mainly using visual methods. It is like playing with the data and exploring it before applying any algorithms or models to it. EDA can lead to the formation of specific hypotheses that could be useful to understand if any more data collection is required for deeper data analysis.
Several graphical techniques are available for performing EDA, the most popular being scattered plots, histograms, box plots, multidimensional scaling, Pareto charts, and some quantitative techniques like ordination, median polish, etc. Some popular data science tools that provide a comprehensive way to use these techniques are as follows:
1. R and RStudio

R is one of the earliest and neatest tools that clean and provide rich data analytics resources. It works with all operating systems, and its capabilities increase significantly when combined with programming languages like C++, Java, or Python. R is the perfect tool that provides extensive libraries for data cleaning, statistical computing, and analytics. You can use the commercial or open-source version of R. Also, RStudio is an IDE where you can write and run R programs quickly and efficiently.
2. Python
For the love of coding, you should choose Python. It has extensive libraries that can quickly perform statistical (descriptive) analysis, correlation analysis, and simple modeling. It is easy to find missing values, outliers, anomalies, and unexpected results in the data and then look at overall patterns and trends visually (like boxplots, scatter plots, histograms, and heatmaps) using Python.
3. SAS

SAS has powerful data analysis abilities and uses the SAS programming language. The tool is ideal for statistical analysis and can support many data formats. PROC UNIVARIATE in SAS provides various statistics and plots for numeric data.
4. KNIME

This is an open-source EDA tool based on Eclipse. KNIME is excellent for those who do not want to do much programming to achieve the desired results. It can perform data cleansing and pre-processing, ETL, data analysis, and visualization. KNIME has been widely used in pharmaceutical and financial domains and for business intelligence.
5. Microsoft Excel
For a regular chunk of data, Microsoft Excel provides some great insights, and you can look at data from various angles to make quick plots and pivot tables that are helpful for quick analysis. Excel doesn’t need programming experience, and you may have it on your system to do other office operations. Thus, you don’t have to spend extra time, money, or resources using Excel.
Machine Learning and Decision-making Tools
With good EDA tools, you will be able to perform qualitative analysis. On the other hand, algorithms and machine learning tools allow you to quantify the analysis and build a predictive model for your business. For example, with EDA, you know that the sales of paneer dosa were way less than masala dosa in the last quarter.
But now we have to know ‘why’ through diagnostic analysis and then build a model that will determine how much the sales will be in the next quarter (read more about different types of analysis here ). Several tools help to employ different ML techniques, like linear regression, decision trees, naïve Bayes classifier algorithms , and others, to understand why something went wrong. It then predicts the future based on both past and present data.
Below are the most popular machine learning and decision-making tools that you can use:
1. R & Python
When it comes to programming, R, and Python are ruling the list of machine learning tools. Python’s easy syntax and a host of libraries and tools are ideal for ML. Some Python tools for ML are Pattern, Scikit-learn, Shogun, Theano, and Keras. In the same way, R has a host of libraries and packages that make ML more accessible, such as e1071, rpart, igraph, kernlab, randomForest, trees, and many more. Check out the most popular ones here .
2. Weka
Weka is a collection of machine learning algorithms that you can apply directly to a dataset or call from your code. It contains tools for data mining tasks, including data preprocessing, regression, classification, clustering, and association rules. It has a neat GUI that will help beginners to understand machine learning effectively. Also, you use Weka in combination with R (RWeka).
3. RapidMiner

Rapid miner is among the most popular tools that support all the data science steps, including data preparation, machine learning, deep learning, text analytics, model validation, data visualization, and predictive analytics. RapidMiner is available for commercial and educational purposes like research, training, and education. You can design models using a visual workflow designer or automated modeling. Also, you can easily deploy, test, and optimize the model for insights and actions. Some older versions of RapidMiner are open-source.
4. H2o

It is an open-source, distributed ML tool that is scalable, flexible, and suitable for linear models and deep learning algorithms. H2o’s compute engine provides end-to-end data science services, such as data preparation, EDA, supervised and unsupervised learning, model evaluation, predictive analysis, and model storage. The tool offers complete enterprise support to boost deployment, making AI development fast and easy.
5. MATLAB

MATLAB is a simple yet powerful tool that is easy to learn. It is used to plot data and functions, manipulate matrices, implement algorithms, and create user interfaces. If you are an engineer, you may have written some MATLAB programs during your college days. Also, you need to note that learning and implementing ML algorithms will be a breeze if you have prior knowledge of C, C++, or Java.
6. DataRobot
DataRobot is yet another powerful automated machine learning tool that allows you to prepare datasets, drag and drop elements to apply models and algorithms, build and retrain the applied model, and make accurate predictions and insights. It is being extensively used in healthcare, finance, banking, and public sector marketing. It can also use libraries from R, Python, and H2o for even faster and more accurate results.
7. TensorFlow

TensorFlow is a free and open-source library designed by the Google Brain team. Google initially used it internally but made it open-source later. Tensor Processing Unit, built by Google, works beautifully for TensorFlow and is specifically suited for machine learning. Combined, you can develop and train complex ML models, iterate and retrain them, and quickly make them ready for production. Other than Google, Airbnb, Coca-Cola, Intel, and Twitter are some big names that use TensorFlow.
Data Visualization Tools
Okay, so we applied our analysis, created a model, and trained it. Now, what's next? We need to present the information we have gathered in an easily understandable form. This is where data visualization comes into the picture. The insights, patterns, and other detected relationships among data are graphically presented so business analysts and stakeholders can make informed business decisions.
We can retain complex information in our memories for longer in the form of pictures and visuals rather than text. Data visualization engineers must be adept in mathematics, graphics, statistical algorithms, and visual tools. Also, they should know what tools are ideal for different business scenarios.
Tools like Excel are good enough for small data sets like daily sales reports or employee leave information. However, for big data and commercial products with complex data, you need to use some popular tools like Tableau, PowerBI, D3, FineReport, etc. The following are the best data visualizations tools:
1. Tableau

With Tableau, you can drag and drop elements to create visualizations. Also, the visualizations you create are in the form of dashboards and worksheets. While it is majorly used for visualization, Tableau can also perform data preparation. Also, Tableau is faster than Excel and can integrate with different data sources to create charts, reports, and dashboards. There are no programming skills required to work with Tableau.
2. QlikView
Qlik is a BI tool, just like Weka, RapidMiner, etc., that can perform end-to-end data science processes like data integration, analysis, and visualization. QlikView is a powerful tool for data visualization that gives insights in the form of dashboards. With QlikView, you can enhance reporting efficiency by more than 50% and get more time to focus on critical business tasks.
3. D3

D3 is an open-source JavaScript library that can create interactive and dynamic data visualizations on web browsers using HTML, CSS, and SVG (Scalable Vector Graphics). It is flexible, fast, easy to use, modular, and supports large complex data sets. The DOM manipulation methods that D3 uses are data-driven.
4. ggplot2
ggplot2 is a data visualization package created for R. It is an enhancement over the basic graphics provided in R; data can be transformed into many layers to provide powerful charts. A similar plotting system is available for Python and is known as ggplot. Both ggplot and ggplot2 require minimal code to generate professional-looking graphs quickly.
5. FineReport
You can create beautiful visualizations using this tool with over 19 categories and 50 styles to represent data in various ways. The dynamic 3D effects are interactive and help business users understand the insights quickly and accurately. FineReport gives a rich display of graphical and geographic information, making it an excellent choice for complex business problems.
Check out the best visualization tools here.
Summary
Are you overwhelmed with the above list of tools? Worry not! Let me tell you a secret – If you are a programmer, start with R or Python, and then move on to other automated products that simplify your life. If you are not technical, start with Microsoft Excel, Tableau, and Weka. Remember that these tools are to help you, not confuse you.
Many of these have a free version, so before choosing one, you can play around with some and decide which one is most suitable for your specific requirements.
People are also reading:


Leave a Comment on this Post