
Do you have any ideas for improving your business processes by using business intelligence tools? If not, you need to know a lot. Sooner or later, companies and organizations of all sizes may require some kind of assistance to make viable and advantageous decisions. Here comes the active role of current and specialized business intelligence tools.
In this blog, we will provide you with an introduction to BI tools, what kind of benefits they offer to an organization, and a list of leading BI tools.
Let's start!
What are Business Intelligence Tools?
BI assists you in understanding business trends and procuring insights from your business data that help you in making strategic business decisions. Besides, business intelligence tools also assist you in identifying patterns in the mountain of data built by your business. These tools make sure all data-related decisions are taken without any massive involvement of IT.
Furthermore, you can collect, analyze, evaluate, and predict future business developments by using these tools efficiently. It also clears your perspective on managing a company's data. Due to all these reasons, business intelligence tools have become an indispensable part of every organization that wants to increase its profit.
Features of Business Intelligence Tools
- BI tools are advanced software that permits the integration of dominant reporting solutions like crystal reports.
- With the help of BI tools, small and large-scale firms can collect, evaluate, manage, and visualize past, present, and potential data in large volumes.
- These tools have simplified the process of decision-making, which turns out to be a profitable deal for every business.
- Business intelligence tools allow seamless and logical scalability of users across an organization, from one user to multiple users, without a major shift in cost.
Top Business Intelligence Tools Every Business Owner Must Use
Let's check out different business intelligence tools that ensure your data management becomes easy and fast.
1. datapine
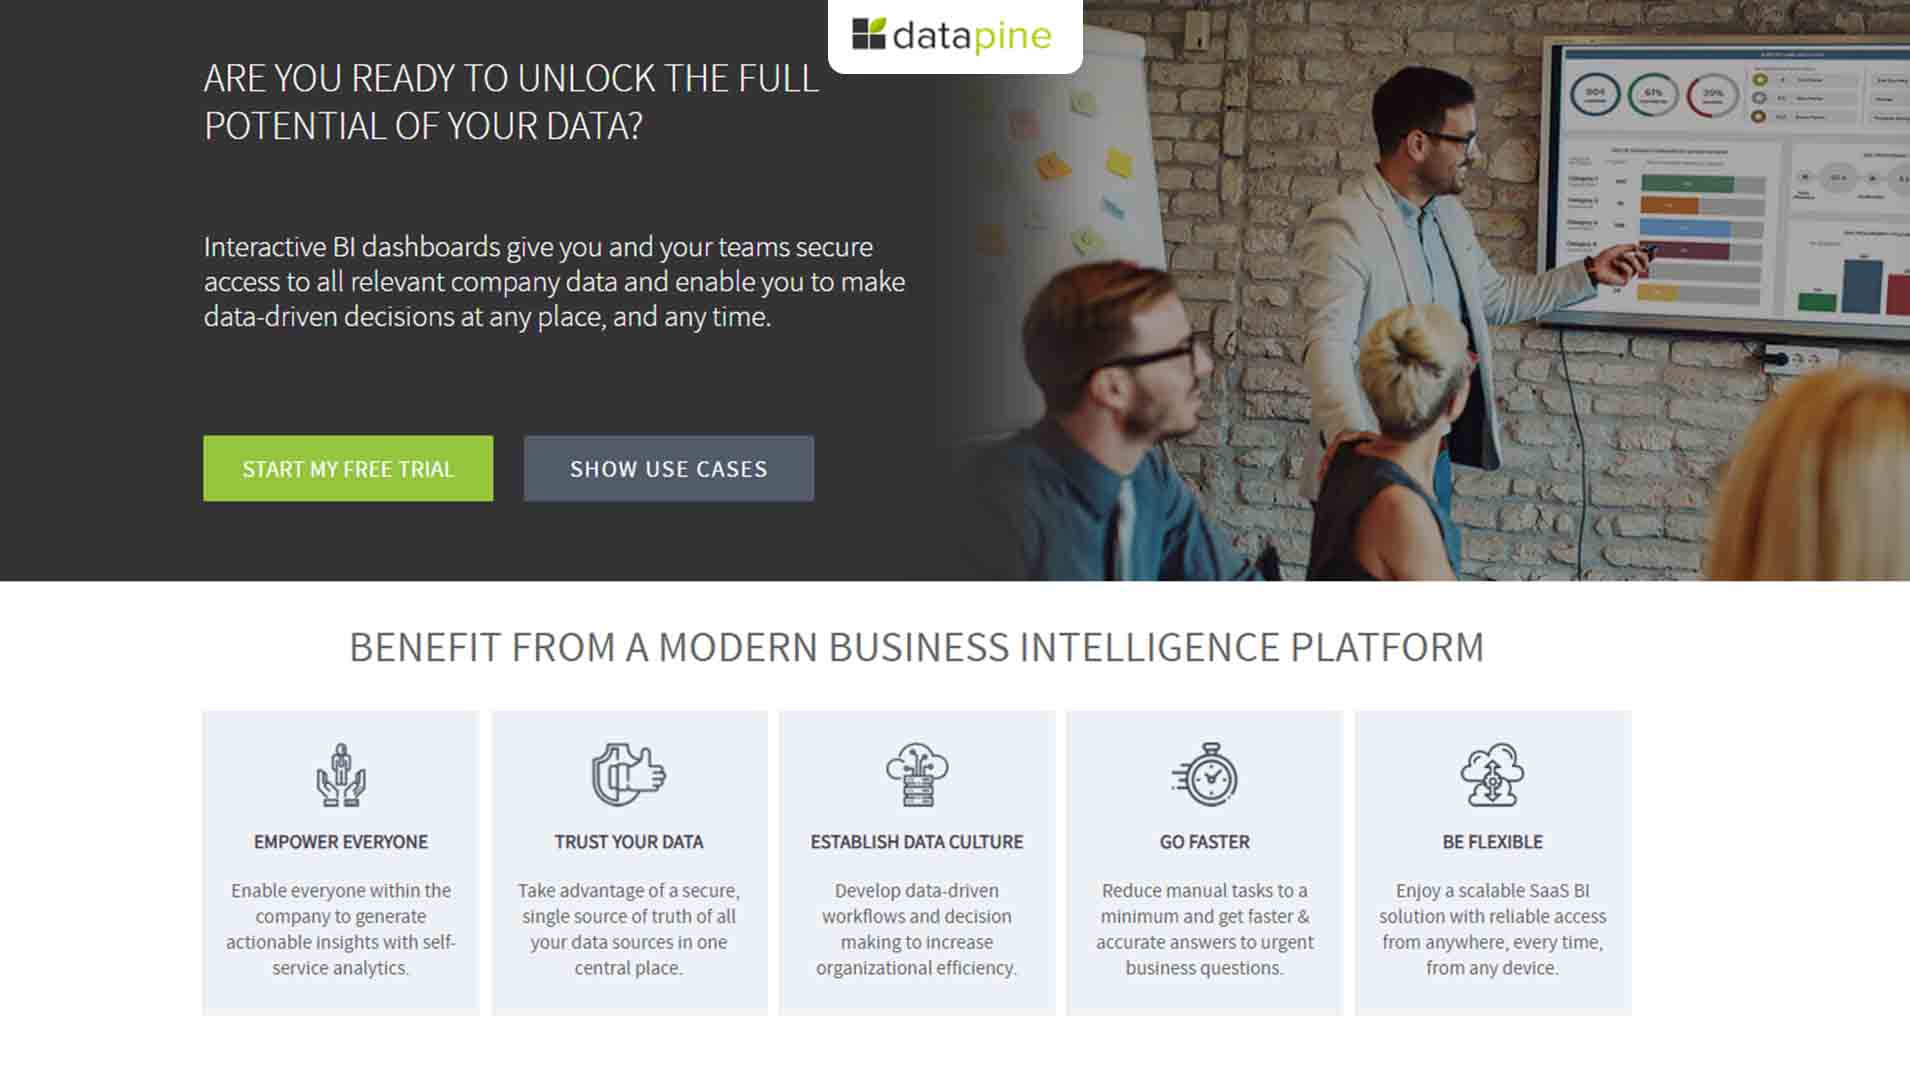
It is a popular business intelligence tool used by many businesses all around the world. This is because users get to enjoy the flexibility to accept data. datapine has simple and unique drag-and-drop features, several charts, and dashboards for showing data.
This tool is also a self-service and visualization solution that permits many professionals to comprehend data. datapine has the edge over many other similar solutions because the tool can connect virtually to any data source.
Key Features:
- Self-Service Analytics : The key role of this software is to help users to visualize data without IT assistance. This is why it comes with a simple drag-and-drop feature for which users don't require any technical skill. You can easily apply powerful filters, run queries, and access data even with the help of a mobile phone. Users can also perform advanced calculations without any hassle.
- Dashboards : Its dashboards can be easily customized so that all periodic reports can be viewed and shared securely with a group of people. This software also gives ideas to build storytelling slides so that data trends can be easily understood.
- Share & Report : The company can easily shift its role toward a more data-driven culture as datapine assists businesses in prioritizing KPIs, due to which every aspect of shared information focuses on striking the bottom line.
- Embedded Analytics : With this, clients can easily embed dashboards and flexible charts directly into the software. It has hidden background filters that help the users to find out the information required by each reader.
- Data Warehouse : This unique feature helps in combining internal and external data into one place. datapine also looks after the present data storage tasks so that the client's total cost of ownership is reduced.
- Multiple Reporting Options : You can create many standard and customized reports with the help of datapine's multiple reporting options. Users can access or send an automatically generated email report that can be automated at limited time intervals. Also, the datapine can be embedded into your phone application.
Limitations: You will get the advantage of mobile access. However, you cannot get direct access to dashboards unless you download their application and design them in the mobile view.
2. Domo
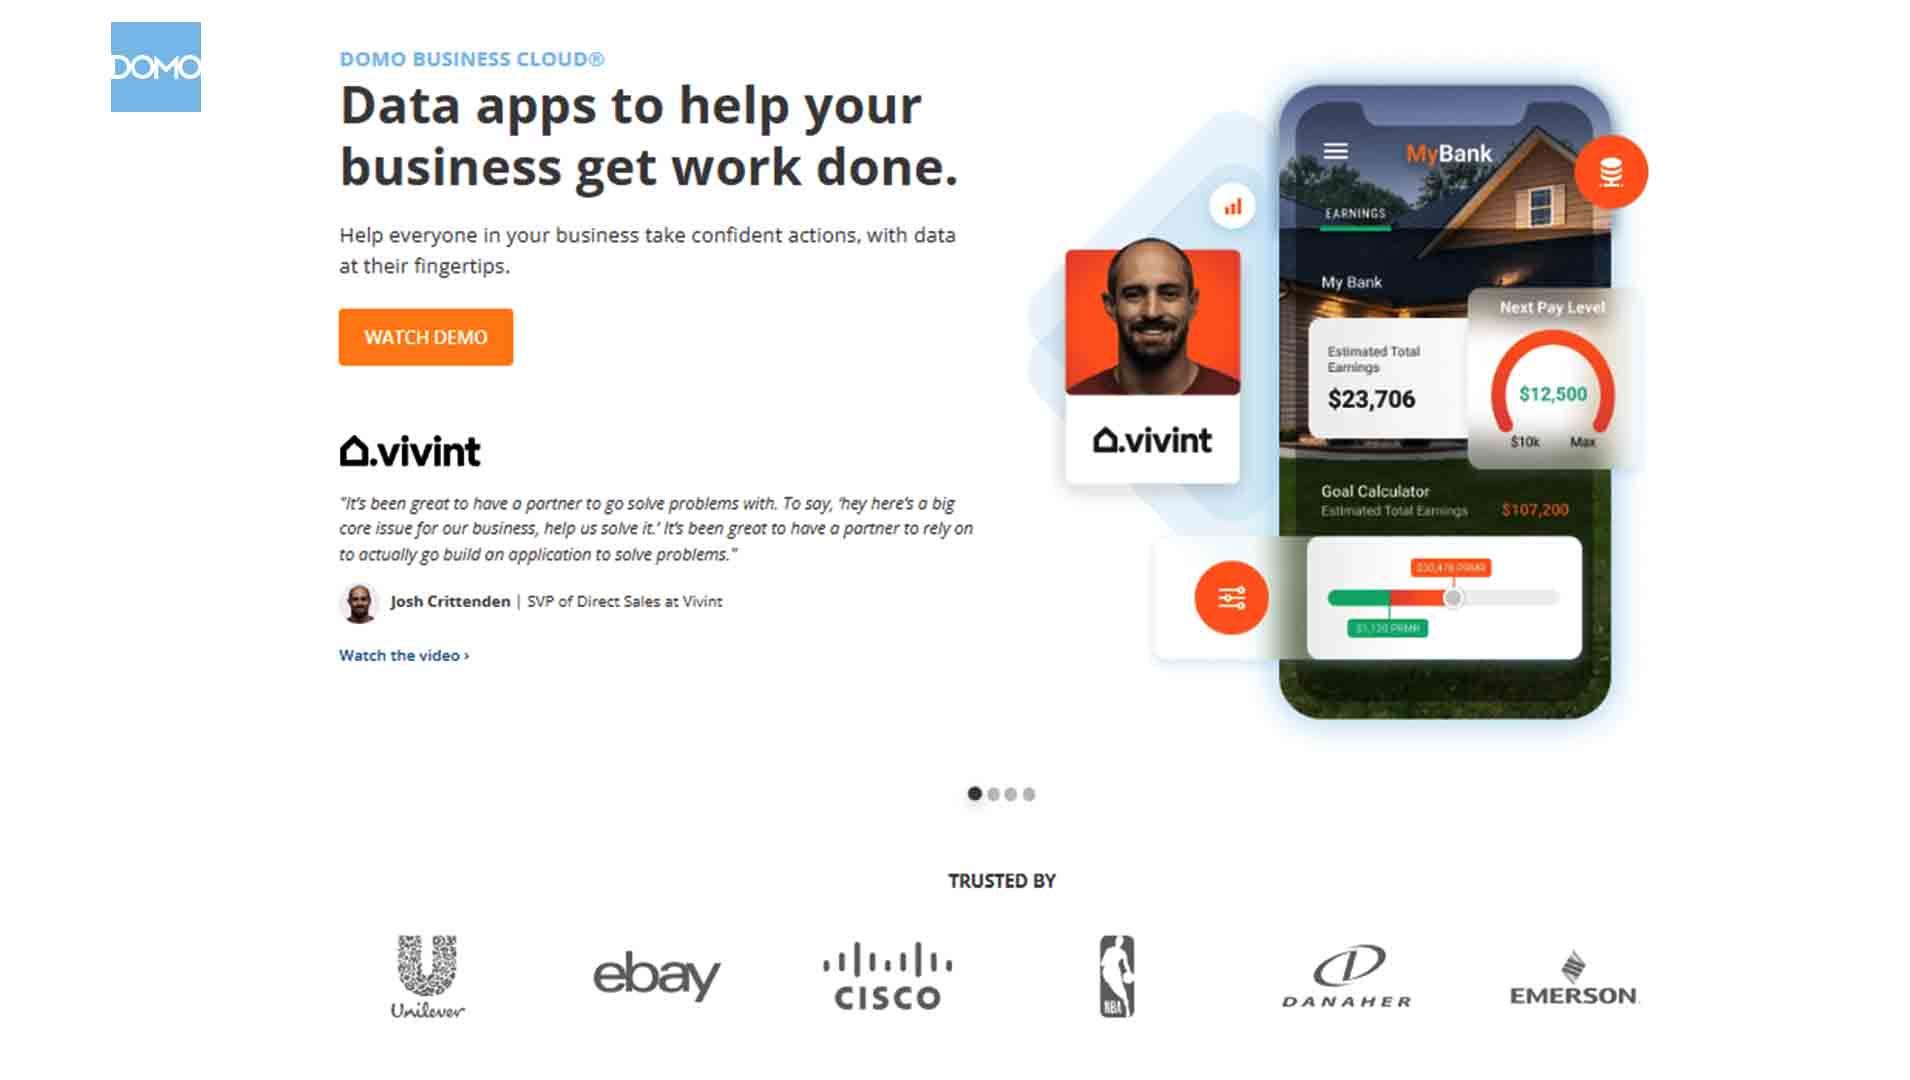
This tool has many systems, including connecting data and completing and extending data along with custom and pre-built apps available at Domo Appstore. Domo can also be used for taking data from outside sources along with using R or Python scripts to make data predictive modeling.
Domo also helps you connect the data to your organization with the help of machine learning and artificial intelligence abilities, enabling the users to find data on their own.
Key Features:
- Self-service : With the help of Domo, every business user can make his own decisions. This tool has self-service, which enables users to filter, divide, and analyze data. Business users don't require any technical knowledge, which was otherwise required in many previously used analytics systems.
- Drag-and-drop ETL : Business users can easily extract data from any source and can process and change it into the Domo platform. Data transformation is possible with a few clicks by making use of integration tools, and ETL solutions will help you visualize data flow, clear out the operations, and review on the fly.
- User Management System : DOMO has a unique user management system that permits you to give an invitation to new users to use the platform. The new users can build and manage groups by access to specific content. You can also use the solution for enterprise-wide deployment.
- Sharing and Collaboration : DOMO has a fully integrated collaboration solution named Buzz that allows users to communicate on visualizations by making use of footnotes or messages. Business users can attach files, look for interactive charts, maps, and graphs, and talk about them with other users or team members included in the group or personal chat, preferably on any device.
Limitations: Domo is not an appropriate tool for newcomers because learning this software takes some time and requires proper training. Also, there is not much transparency in the pricing model, but it can potentially be an expensive deal when considering buying Domo.
3. Pentaho
 Pentaho Business Analytics is a robust BI tool that assists you in gaining insights into making important business decisions and managing your data. Significant characteristics of the software include data visualization, reporting, data modeling, dashboards, mobile access, and many other analytics abilities.
This tool is beneficial for businesses of all sizes and can be considered a fixed implementation. Being open-source, it compares present data against future data. With the tool, you can create reports in formats including Excel, Text, PDF, HTML, and XML.
Key Features:
- Data Source : It creates an interactive analysis report with the help of data collected from CSV files along with relational data models.
- Data Integration : It offers flexible data integration no matter what type of data it is. Pentaho has Extract, Transform, and Load abilities to catch, cleanse, and store data by making use of a uniform format.
- Reporting : Pentaho helps you view reports in the dashboard along with different capabilities like drag-and-drop, column resizing, unlimited undo and redo options, sorting, font selection, and more.
- Role-based Security : It puts some restrictions on the axis of some metadata models, which act as a data source. Users get a column, table, and row-level approval control.
- Mobility : You can have instant access to business analysis by using the mobile application for iPad, which operates using touch navigation technology.
Limitations: Though the software is good for the dashboard, it doesn’t give clear error codes and comprehensive explanations to resolve the problem. After some time, a database connection is lost.
4. IBM Cognos Analytics
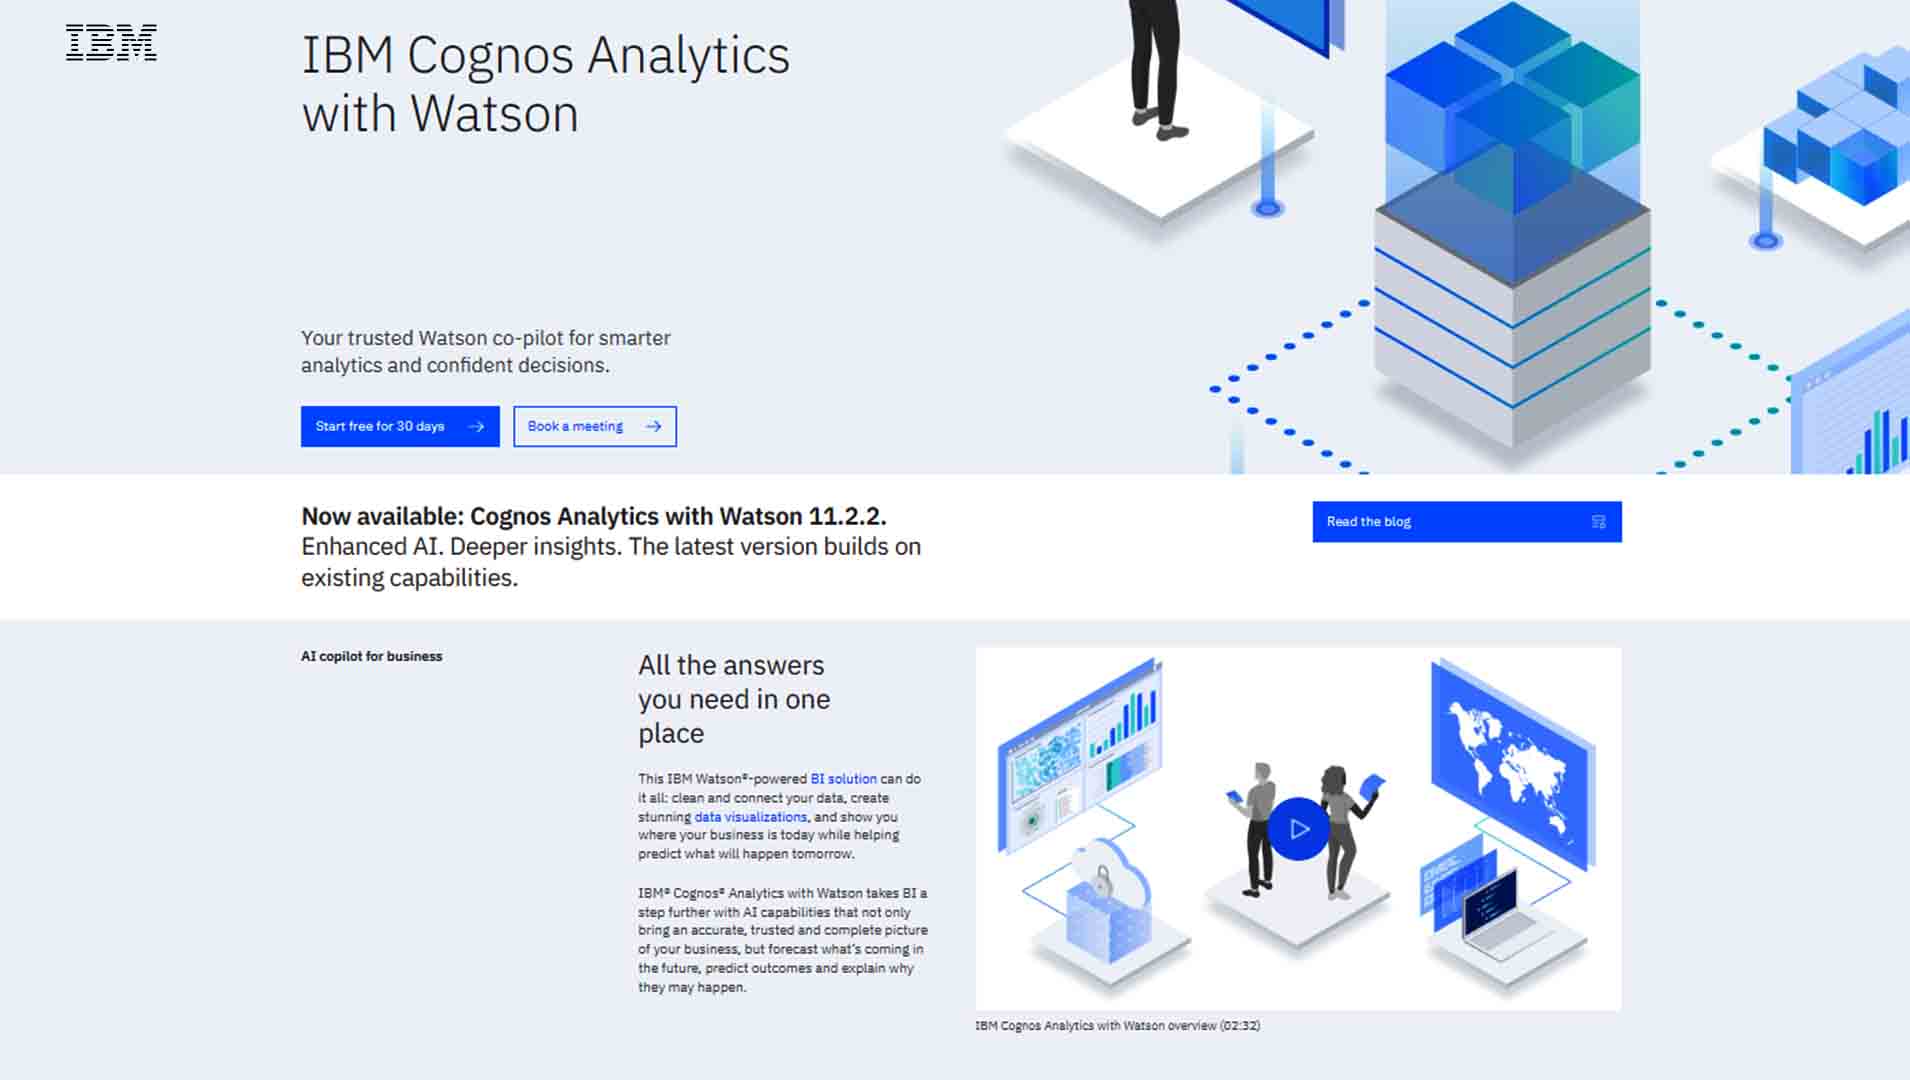
Cognos Analytics is a self-service, cloud-based BI platform that empowers you to find out data through data analytics, reporting, metrics, and KPI monitoring. The reports provide you with the capability to visualize your insights and share them easily with employees and colleagues. It is unified with Watson Analytics, which supports AI and natural language processing of IBM to create more accessible insights for non-technical users.
This tool's unique features provide extra functionality, dexterity, and flexibility at the time of processing large sets of the database. Cognos Analytics is a powerful software from one of the industry leaders in software development.
Key Features:
- Components : Users can increase the feature set of the main platform with the help of components that improve data modeling, analytics capabilities, and visualization.
- Extensive Knowledge Center : It is a complete knowledge center and supports businesses that want to get a deeper understanding of their products.
- Powerful Reporting : With the assistance of its powerful reporting suite, you can make detailed charts, maps, crafts, and voiceovers. It certainly simplifies the reporting for non-technical users using express mode.
- Web-based Interface : You can have access to the platform on any required hardware by connecting to the web.
- Natural Language-powered AI : The platform examines the data and receives natural responses because of a built-in AI, which NLP powers.
- Automated Modeling : With the help of automated modeling, the platform verifies and combines data. It also finds out the relationship between different data points.
Limitations: It may take some time to get familiar with all the functionalities of the software. Also, if you want a complete dashboard feature, look for some other tool. Cognos Analytics can also be an expensive deal for small firms and start-ups.
5. Tableau
 Tableau is the most convenient data visualization tool that allows users to transform their numeric and textual data into dashboards. Moreover, it is a user-friendly software that facilitates you to convert raw forms of data to understand data. Companies, as well as individuals, use Tableau and have already grabbed the benefits of its insightful data visualization.
Ranging from marketing, healthcare centers, and insurance companies to manufacturing and wholesale industries, many markets make extensive use of this powerful BI tool.
Key Features:
- Ease of Implementation : The wide variety of visualization options allows users to have an unmatchable experience. It is not rocket science to learn to operate Tableau. In fact, a layperson can work like a pro on Tableau after using it for a few days. Even if you do not have any knowledge about business objects, you can start using Tableau conveniently.
- Support for Multiple Scripting Languages : This is the most useful business tool because it helps you perform complex table calculations quickly. Moreover, you can incorporate different scripts, including Python and even R, to take the extra load off and do all the data-cleaning tasks.
- Mobile Support and Responsive Dashboard : Tableau has gained immense fame because of its fantastic reporting feature. The business intelligence tool is capable enough to predict what kind of device a particular user uses and will further make suitable adjustments on its own. Furthermore, it will deliver the rightful reports to the specific device you will be using.
Limitations: The primary reason for not using Tableau is its limited table displays. The business tool allows a maximum of 16 columns of table display. Moreover, the other important shortcoming of the BI tool is its static parameters. You can select only one value at a time.
Furthermore, Tableau doesn’t provide automatic refreshing, which means you won’t be able to do the scheduling. In fact, you will have to put in your manual efforts whenever you need to update your raw data in the back-end.
6. Looker
Looker is an ultimately useful data exploration solution based on the cloud. No matter whether you have a small or a large team, Looker will facilitate you to generate your business reports within a fraction of a second.
In fact, the business intelligence tool allows you to create your own visualizations and graphs instead of copying them from Excel sheets. This tool is competent in web-based data and can support around 20 variations at a time.
Moreover, talking about its usage, any individual who has basic knowledge of SQL coding can operate Looker.
Key Features:
- Easy-to-use : You don’t need to be an experienced data analyst because Looker is extremely convenient to use. Just a little knowledge of SQL code is enough because multiple operations will come down to self-created codes. Moreover, you can get access to accurate charts and tables you want. In fact, you will also get self-service features. For example, filtering and pivoting.
- Handy Visualizations : Looker consists of a handy left-side menu that contains all the settings and your personalized workplaces. Moreover, you can also use the specific scheme to assign different roles. These schemes also allow you to drag and drop multiple elements. However, the best part about Looker is that it facilitates its users to make connections between data objects and third-party workflows. This is possible only with Webhooks.
- Strong Collaboration : To make the user experience a little more pleasant and convenient, Looker streamlines collaborations. The business tool is accessible to multiple mobile phones. In fact, it allows you to share your data or final reports via email and URL to several applications like Excel and even third-party applications. Hence, you can export your data manually to any kind of file.
- Flexible LookML Language : The users can use LookML to create mini-applications that will further empower the data exploration. This language has the extra benefit of conveniently creating powerful models. In brief, this language-based approach will optimize your performance.
Limitations: Looker seems to be inappropriate for small teams and is completely sluggish with huge complex data. Also, Looker is quite expensive, and not every business owner can afford it. The business intelligence tool doesn’t guide your team on how to operate it.
7. Halo BI
 Halo BI is an end-to-end business intelligence solution that improves your productivity. It assists business owners in the entire planning process. Halo is a simple platform with multiple technologies in itself.
For example, data aggregation, mobile access, data cleansing, massive data access, cloud computing, and information dissemination. In fact, you can use it for performing several tasks, including:
- Visualization,
- Reporting, and
- Analytics.
Key Features:
- Optimized Data Warehousing : Halo BI comprises an ETL process and assurance tools. This business intelligence tool creates only one centralized source of truth and ensures the delivery of the right reports without any unnecessary delay.
- Enhanced Collaboration : Halo is a prominent business intelligence tool that allows its users to share valuable information among the entire team quickly. Moreover, this will help them get even more promising results easily.
- Risk Management : The BI tool consists of predictive analytics that will further help users predict the risk scoring and influence of potential scenarios.
- Self-service Business Intelligence Tool : The business intelligence tool enables its users to find the perfect answers to their queries and get a comprehensive understanding. In fact, business owners can now manage their dashboards with Halo without hiring an IT expert.
- Supply Chain Visibility : Halo BI allows users to shift from disparate data to unified data. It also maintains a holistic view of the entire supply chain. However, the user must have forecasting capabilities to manage supply chains with Halo’s help in a better way.
Limitations: It can take time to implement the Halo business intelligence tool. It costs more to upgrade to more bandwidth. Moreover, the installation procedure is quite complex.
8. ZOHO Analytics
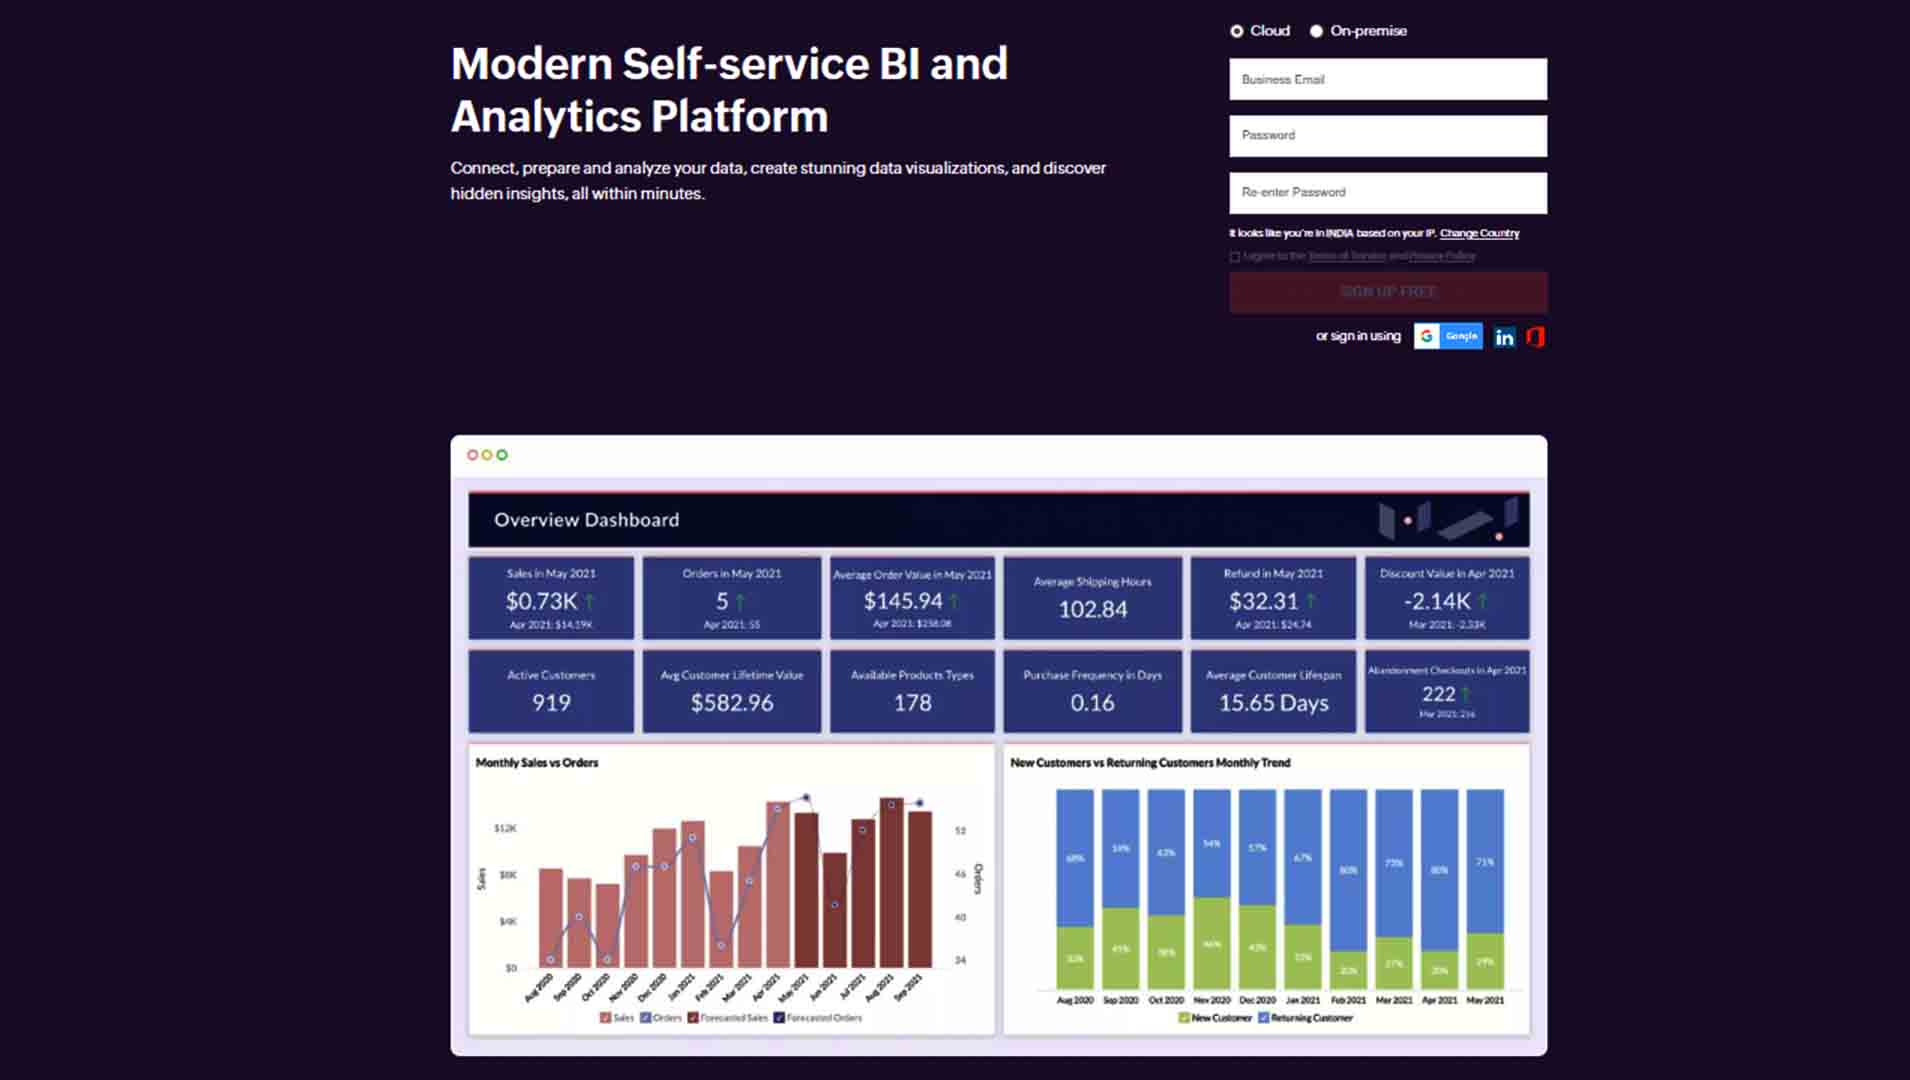
ZOHO is a widely-used business tool that is available both on the cloud and on-premises, offering help to all kinds of businesses to get valuable insights. In fact, you can synchronize your data from several file types, including web, spreadsheets, and traditional applications. Moreover, you can easily drag and drop analytics.
Well, the best part about the business intelligence tool is its easy-to-use assistant, named Zia. It allows users to perform myriad tasks, including combining data and visualizing the results from graphical data. Furthermore, ZOHO Analytics facilitates its users to create ad hoc reports in the shortest possible period.
Key Features:
- Intellectual Assistant : Zoho is the perfect artificial intelligence analytics because of its extra intelligent and supportive assistant. You can ask it about anything at any stage. It is mainly based on natural language processing and helps you search for anything quickly.
- Geo Visualizations : This feature is probably the best feature of Zoho Analytics. Not only data visualization, chart, and model creation, but it also assists you in analyzing geographical data. In fact, you can ask about the analysis of geographical locations from maps across multiple regions, countries, and even latitudes.
- Data Blending and Visualization : This is the most highlighted feature of Zoho Analytics that enables the users to blend and visualize data from several sources. Well, not only blending, but you can now feed your data from several online sources with Zoho.
- Comments Section : Zoho enables your entire team to opt from shared views, and you can post comments in real-time on different parts of your report like charts, tables, and even dashboards. Moreover, you can now attach some files and crop your display screen with Zoho.
Limitations: The most problematic shortcoming is its tutorials. Moreover, the mobile app and the live chat option miss the mark. However, the most annoying part of ZOHO Analytics is that it automatically marks the events closed on the arrival of a date, which is not good.
9. SAS Analytics
SAS Analytics is a discovery platform that makes a comprehensive analysis and identifies data patterns and insights. In fact, you can use this business intelligence tool to create ad hoc reports and enhance your business trends. Moreover, you will get access to multiple types of reports. For example, vectors, pie charts, and scatter graphs. Well, this business tool can help you filter and customize your data to reach some specific data requirements.
Furthermore, the most beneficial fact about SAS Analytics is its compatibility. The BI tool offers mobile apps for both Android and iOS. It facilitates you to interact with your dashboards anytime and from anywhere.
Key Features:
- Simple to Operate : This is the most prominent advantage of the business tool in that it comprises simple syntax. It consists of no programming and can still resolve a business’s complicated issues.
- Text Analytics Capabilities : The business intelligence tool enables users to gain significant insights from social media and location analytics.
- Deals with an Extensive Database : This is probably the most beneficial feature of the BIT tool. It allows you to add new possibilities and manage a huge volume of data.
- Analyzed Algorithms : SAS Analytics consists of a completely analyzed algorithm. This is a closed reference language and facilitates its users to build time-value determination.
Limitations: The primary shortcoming of SAS analytics is that it is not open-source and is not open to utilization generally. Moreover, the pricing is over the top of what a small business owner thinks of using it. Also, it supports only a few platforms, and the interface needs to be updated.
10. Qlikview
Qlikview is probably the most flexible business intelligence tool that is specifically designed to help business owners extract information from the data available. It supports multiple data sources and file types. In fact, it is well known for keeping your data confidential across all devices.
Moreover, Qlikview consists of an in-memory technology that reduces the requirement for IT experts and minimizes the company’s expenditure. The only thing that has made it gain immense fame is its consolidation of data. It can consolidate data from multiple sources and will provide centralized data for high-level business reports.
Key Features:
- Self-service Tool : QlikView is a widely-used self-service business intelligence tool that never relies on IT workers for anything and does everything itself. In fact, this tool’s dashboard modifications do not need any professional handling. Any non-technical person can work conveniently.
- Low Maintenance : To implement QlikView is the simplest task and is hassle-free. Even after installation, the business intelligence tool doesn’t require technical supervision and high-cost maintenance.
- Data Interpretation and Analysis : Qlikview consists of dynamic applications that facilitate users to interpret and analyze the entire data within a short period.
- Data Security : The developers of Qlikview guarantee that the user data will be kept secure.
- Direct and Indirect Data Searched : QlikView users can launch both direct and indirect data searches. Well, you can insert something relevant to your data, and this business tool will give relevant results.
Limitations: No matter how much heavy data QlikView can handle, the computer you will use will put a limit on its RAM. This means the number of tables, rows, cells, columns, and even fields you will use will solely depend on its RAM.
In fact, QlikView users will have to make some extra purchases, and the BI tool has a poor customer support system. Furthermore, QlikView lacks all-new drag-and-drop functions, and it’s not possible to work on modern interfaces while using QlikView.
Benefits of Using Business Intelligence Tools
BI platforms and tools proffer various protruding benefits. Here, we will discuss the most important ones:
1. Efficiently Gather Relevant Data
No matter if you are a part of any small-scale company or a large firm, collecting data from different portals is a major requirement. As data collection from different sources is a cumbersome task, you may require massive data intelligence to cope with all the sources and build an improved understanding of the gathered information.
For this, modern business intelligence tools will assist in concentrating on the contrasting sources and giving you a single viewpoint on all the business processes. This will consequently help you identify issues and trends so that you can take timely action and make correct decisions.
2. Increased Organizational Efficiency
When you use modern business intelligence tools, you get better access to data. This is an advantage in understanding business operations and eventually improving results. Even a small-scale company, by making use of BI tools, can stand against large enterprises. Once an organization has a holistic viewpoint, better opportunities in different business areas can be identified.
To exemplify, Pfizer uses BI tools to fraternize among departments and designed models to help diagnose patients faster and better. Besides, PEMCO, an insurance company, also makes use of Tableau in its operations so that it can manage and close claims more efficiently.
3. Data-Driven Business Decisions
As BI tools aid businesses in getting accurate and faster data, decision-making improves. Many companies have started using customized mobile dashboards, especially for the sales department, which will help them in viewing real-time data and predict sales before connecting with potential clients. This tool will help you speak more confidently with prospects and clients due to familiarity with up-to-date data. It will also reduce the time that is otherwise wasted on waiting for reports.
4. Eliminating Manual Tasks
Taking the traditional means of business management into consideration, the use of spreadsheets along with static presentation is a part of report handling. However, modern business intelligence tools completely eliminate the constant amount of columns and rows, improving the automation of processes.
Whenever you require a report, the BI tool will update your KPI dashboard by making use of the available real-time data. In addition, if you need a presentation or drag and drop your values, BI software will develop a powerful and interactive dashboard for you in no time. The dashboard will allow you to correspond directly to your screen.
5. Enhanced Employee Satisfaction
Every time contacting an IT analyst takes extra time because, most of the time, a department responds late to your request. However, BI tools enable employees to have access to their own data without connecting to any data analysts. Employees can do data analysis on their own with minor training. So, if your organization has employees who crave data, BI tools and software will be of great help.
All the benefits offered by business intelligence tools focus on both small companies and large organizations. For controlling and managing your data and understanding what is actually going on in the organization, BI tools should be your first consideration.
Final Verdict
Going with the trend can only help your business to do profitable deals in the long run. You can make it possible by using the best business intelligence tools diligently. To find out which solution can be suitable for your business, you can check out the most promising tool by trying its free version. In short, the best BI Tool will provide insights into your organizational needs, fit according to the capabilities of your users, and provide data in actionable formats.
Choose the tool wisely so that you can gain the maximum benefit out of the same, leading to better decision-making.
We hope that the aforementioned information helped you understand the topic in detail.
People are also reading:
- AI Interview Questions
- Artificial Intelligence Technologies
- 10 Best Data Analytics Tools for Your Business
- Difference Between Data Science vs AI (Artificial Intelligence)
- Best Virus Removal Software
- Best Hacking Tools & Software
- Best Tools to Remove Background from Image
- Best Online Port Scanners
- Best Open Source Monitoring Software
- Best Video Editing Tools