
In computer programming, debugging is the process of identifying errors or flaws in the source code and fixing them to make it error-free. JavaScript (JS) debugging can be tricky! Most often, there are no compilation and syntactical errors, but the code does not work properly. In such circumstances, the primary concern is how we can debug the code and reach the root cause.
Almost all browsers today come with a default JS debugger. This debugger has breakpoints that can be set while debugging the code. These breakpoints can stop the program’s execution at any required moment, and you can check the program's variable state. Moreover, there exists a helpful object for JS debugging called a console.
Let’s study the console object and other ways to debug JS in this article.
console
`console` is a Javascript object that provides users with a vast set of methods and access to the browser's debugging console. It can be accessed from any global scope and is available as `window.console`.
There are a lot of JS debugging ways that developers use all over the world. Following is a detailed explanation of JS debugging tips that can be mastered to catch that bug!
10 Best JavaScript Debugging Tips
1. The Famous console Methods
This is the widely used debugging method in the frontend world. The developers add numerous console methods in their applications to reach a root cause.
Some of the functions of console debugging are as follows:
-
console.log()
This is a widely used method by developers. It is used to print the current state of variables during the program’s execution.
Example
Consider the following JS functions. It has two console logging.
function checkMod () {
 let obj = Math.random();
 let result = obj % 5;
 console.log({result});
 console.log({obj});
 }
Output
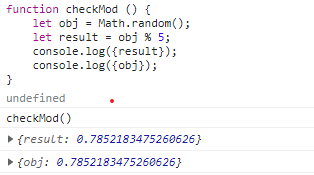
Note : Take note that we need not write console logging as below. There is an object notation where we can name and display the object in one go.
console.log(“result”, result) X
console.log({result}) ?
-
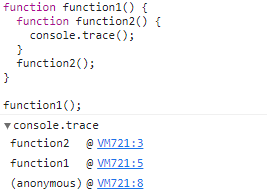
console.trace()
This console method is used to get the stack trace of any function.
Example
function function1() {
 function function2() {
console.trace();
 }
 function2();
}
function1();
Output
-
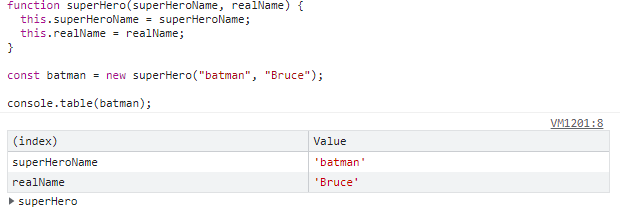
console.table()
This console method prints the data in a tabular form. The tabular data is easy to read and identify.
Example
function superHero(superHeroName, realName) {
 this.superHeroName = superHeroName;
 this.realName = realName;
}
const batman = new superHero("batman", "Bruce");
console.table(batman);
Output
-
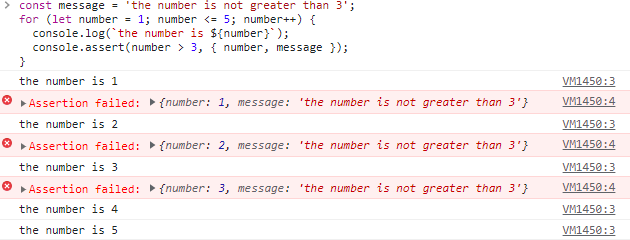
console.assert()
This method is used to write an error message if the assertion is false. If the assertion turns out true, then nothing happens.
Example
const message = 'the number is not greater than 3';
for (let number = 1; number <= 5; number++) {
 console.log(`the number is ${number}`);
 console.assert(number > 3, { number, message });
}
Output
-
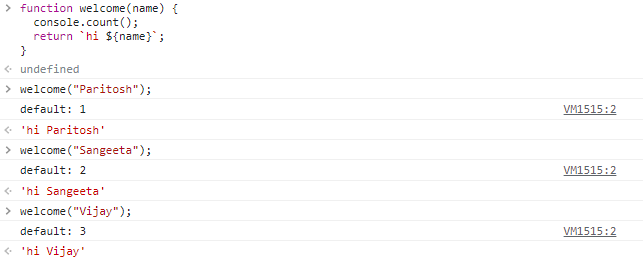
console.count()
This method logs the count of the number of hits to the count() method.
Example
function welcome(name) {
 console.count();
 return `hi ${name}`;
}
welcome(“Paritosh”);
welcome(“Sangeeta”);
welcome(“Vijay”);
Output
-
console.clear()
This method is used to clear the browser’s console when it is filled with console logging.
Example
Just write console.clear(). It will clear all the mess that is displayed there.
2. Use Debugger
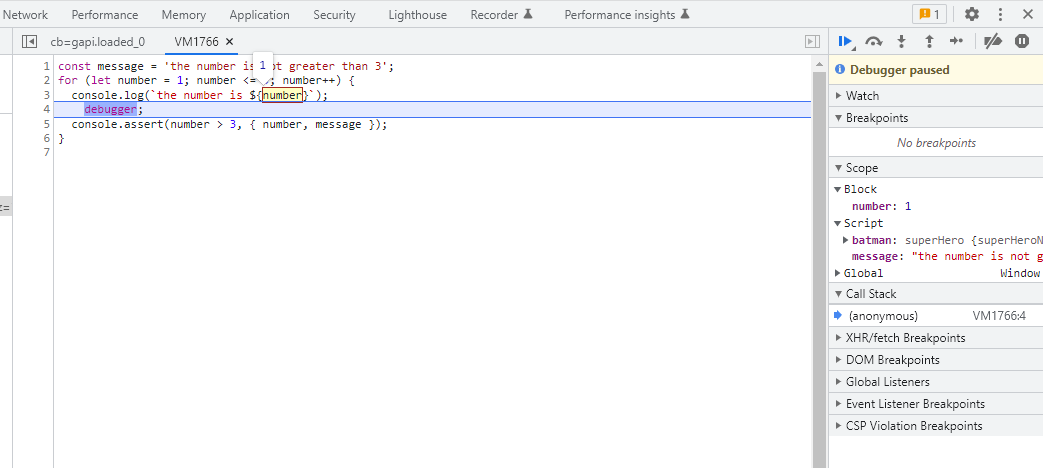
The debugger statement is used as a breakpoint in the application. This should not be committed in the application. Rather, it should only be used locally while debugging the application.
This statement will pause the application, and the developer will be able to see the current state of the application.
Example:
I repeated the code mentioned in console.assert() as an example. I have added one extra line, i.e., debugger, inside the loop. When I executed the program, the application stopped on the debugger, and I could see the variable’s state at that moment.
In the screenshot below, we can hover over the number variable to see its value.
const message = 'the number is not greater than 3';
for (let number = 1; number <= 5; number++) {
 console.log(`the number is ${number}`);
debugger;
 console.assert(number > 3, { number, message });
}
3. Debug by Conditional Breakpoints
When we require a specific value during the program execution, conditional breakpoints come in handy. For implementing a conditional breakpoint, we need to attach the breakpoint first and then follow the below-mentioned steps.
- Make sure you have put up a debugger on the required line.
- Right-click on the blue-colored debugger and select Edit breakpoint.
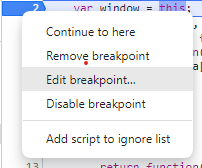
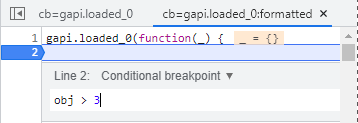
- After selecting the edit breakpoint section, you will be provided with a space to put the condition that you want to execute. You can put any condition there, and code execution will stop once that condition is met.
4. Check All Resolutions before deploying
This is one of the helpful features available in Google Chrome and many other browsers. It provides the simulation of mobile devices, which helps developers to fix UI alignment issues related to specific devices. To test this feature, you have to click on the button shown below, and the application will render on mobile.
5. Introspect the Application’s Performance
This is a unique and important debugging feature in browsers. It is widely used in the areas where we need to evaluate the application performance.
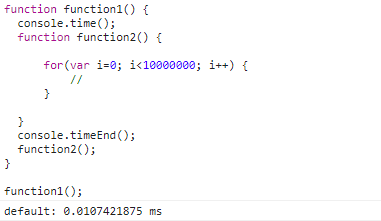
Here, we can start a timer with the help of console methods and calculate the time taken by a function to complete. Let's go through the example.
function function1() {
 console.time();
 function function2() {
 for(var i=0; i<10000000; i++) {
 //
 }
 }
 console.timeEnd();
 function2();
}
function1();
There are two console methods above.
- console.time() - To initiate a timer.
- console.timeEnd() - To terminate the already initiated timer and save time.
The time taken by the above code is around 0.01 seconds on my machine. The output is appended below.
6. Debug the DOM Node Changes
This feature is related to DOM manipulation. We can select some changes at the DOM, and if the program execution matches our changes, the debugger will be initiated.
The following are the steps you need to follow to initiate this process.
- Press F12 and open the developer console.
- Go to the Elements section and click on any DOM element you want to put a debugger on.
- Right-click on the DOM element and select Break On.
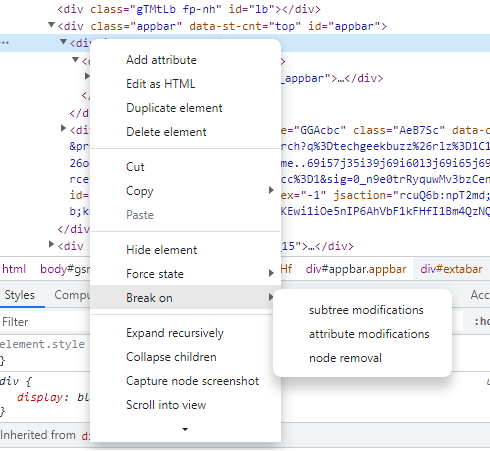
- Select any condition you want. The application will break if this matches during program execution.
7. The Ugly Code
The uglification and minification is a process in which the code of a website is reduced to its minimum by removing all the unnecessary characters. This eventually leads to faster execution of the website and a reduction in load times.
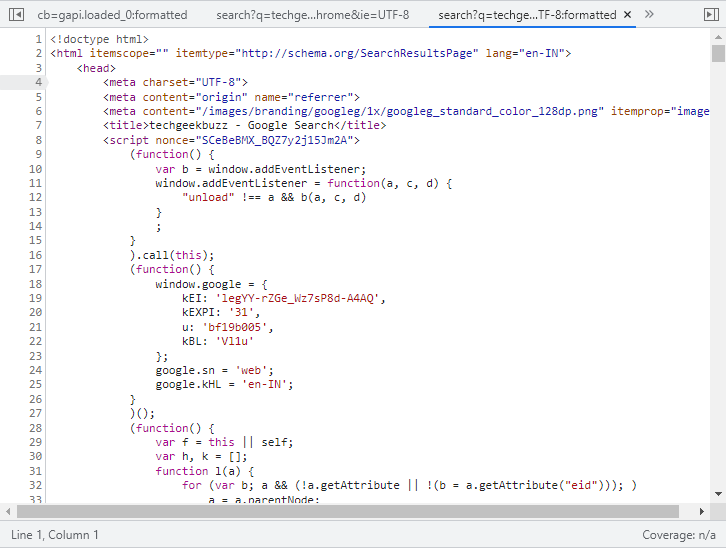
By default, all the websites are minified during the rendering process. But we can unminify it. Thanks to Google Chrome. There is a small button at the bottom of the developer console screen that looks like two curly braces {}.
When we click on that, the code gets unminified and looks way prettier.
If you go through the screenshots below, the left screenshot is the minified form of the JS pages. If you look closely, there is one small button at the bottom left section in the left screenshot. When you click on that, the code gets unminified and much more readable. The unminified code is on the right.
Minified code
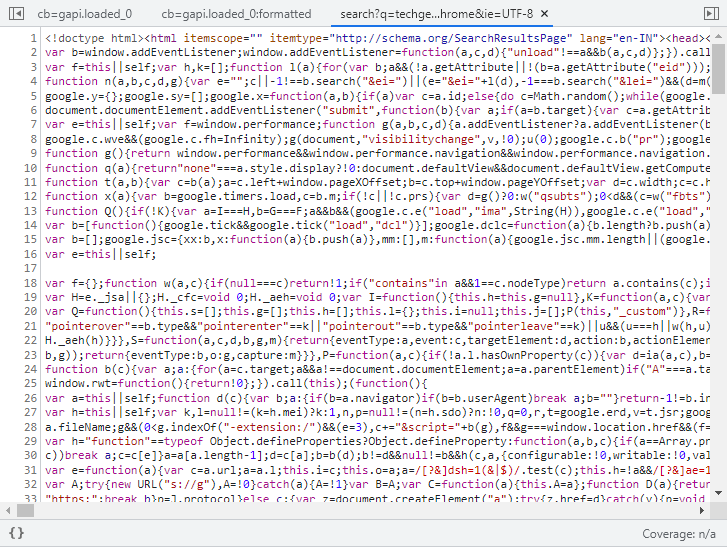
Unminified code
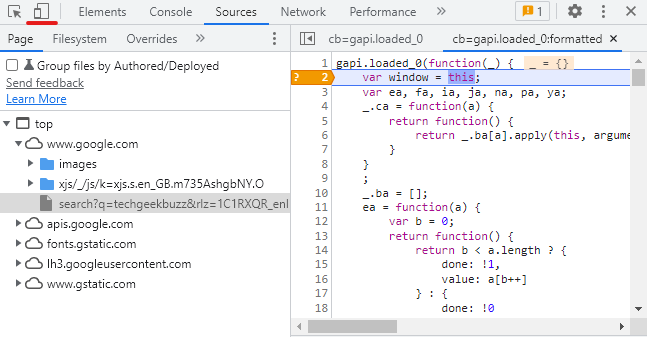
8. Add Variables in Watch Section
In the developer console, there is a Watch section as shown below.
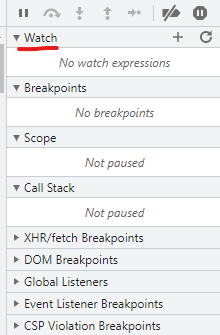
We can add variables here with the same name available in our code. When the value of those variables changes, we will be able to see those values right there in the watch section.
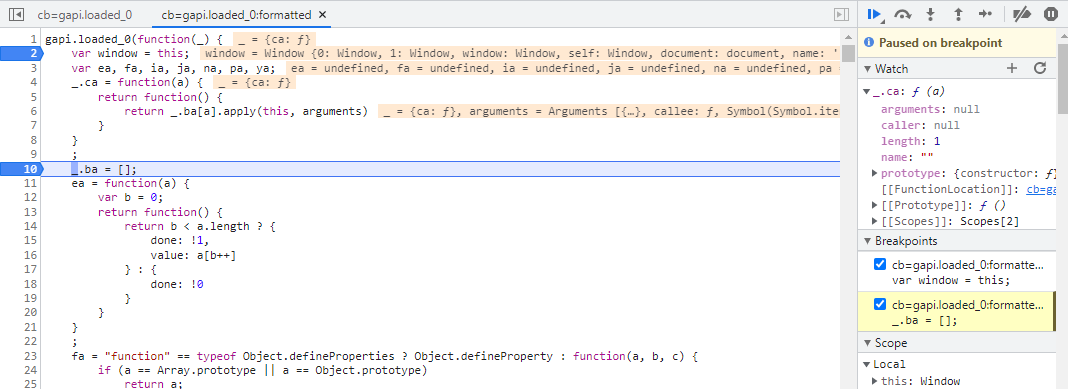
Example
- I have created a variable named _.ca in the watch section. Its value is undefined now.
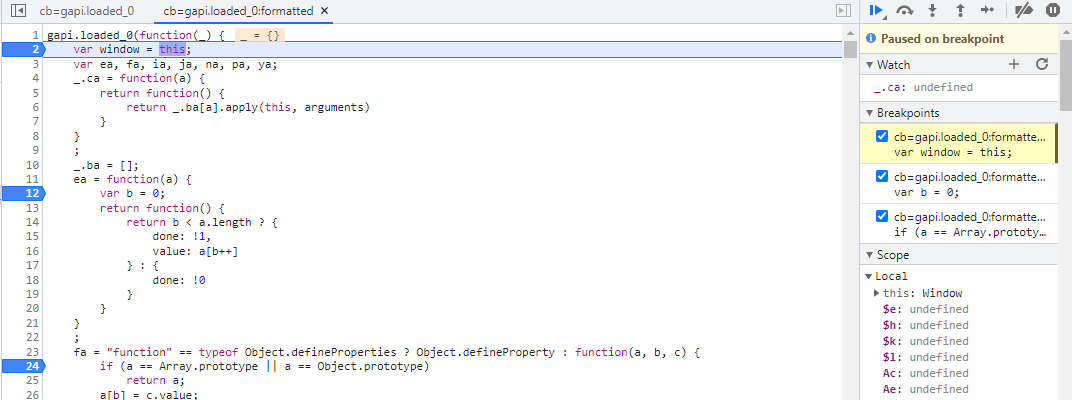
- But when the code execution passes through line number 4, its value will change as the _.ca is initialized with a function now.
9. Hop-on The Network Tab
The network tab is a very useful tab in the developer console. It has all the information of the XHR request that is sent to the server by the application.
This complete information includes the request sent to the server, the response received from the server, header information, and error messages.
The network tab is very useful when we are implementing our application, and we need to create forms based on the response that is being received from the server.
Example
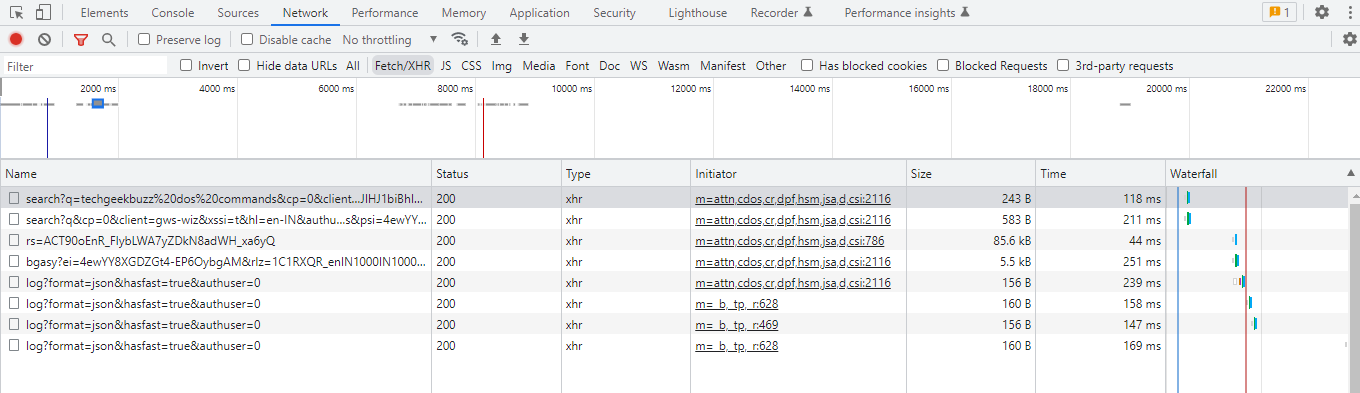
This is what a network tab of a running application looks like. If all requests are successful, then the status will be 200.
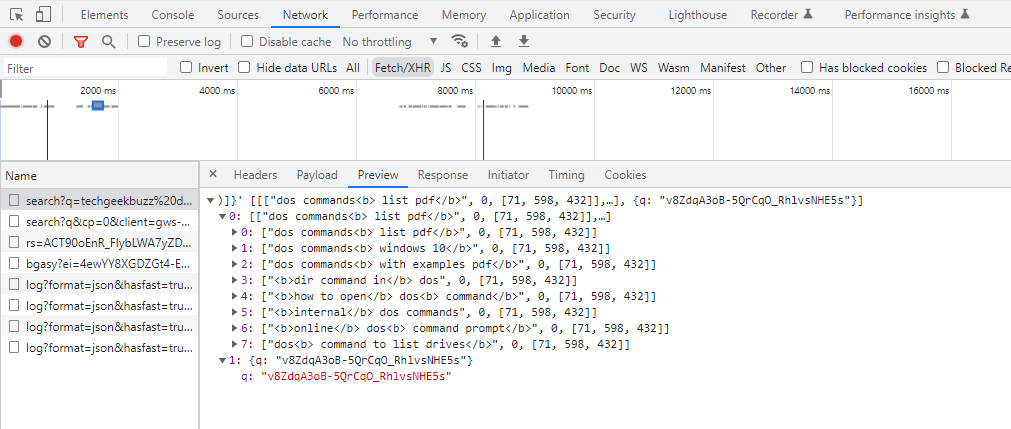
You can click on any of the requests to see the responses received from the server. It will look like this.

10. Use Testing Framework
There are a lot of testing frameworks available in the market today that help us find errors in the application. We can integrate these testing frameworks with our application. The logs provided in these frameworks help reach the root cause of the issue faster.
Some of the testing frameworks are mentioned below.
Jasmine has very useful and straightforward syntax. It is an open-source testing framework that can be used for test-driven application development. Jasmine provides assertions and allows the developer to add any library per the requirement.
This is one of the unique tools I have worked on. It provides the details of all the crashes at the production site with the logs. These logs help us to know our code better and improve the code for future builds. It's not free, though!
Conclusion
In this article, we have gone through the list of Javascript debugging tools. We have tried to cover all the widely used practical tools in this article. These debugging tips will help you to identify the bugs in the application and help you to resolve them faster.
Do send us an email if you have any questions regarding these debugging tips. If you think of a debugging skill that can be added here, comment below, and we will be happy to add it here. Thank you for your time.
People are also reading: